Creating Charts with ChartJS and displaying in vRealize Operations

Creating Charts with ChartJS and displaying in vRealize Operations
I like the idea of using VMware vRealize Operations as the “Single Pane of Glass” for all monitoring. The Citrix Team recently asked me if I could show license usage within vRealize Operations. They wanted to see the highest usage in the last 30 days, 10 days and 24 hours. Citrix license usage is not built into vROPS but I have used the “Text Display Widget” to show other information within vROPS.
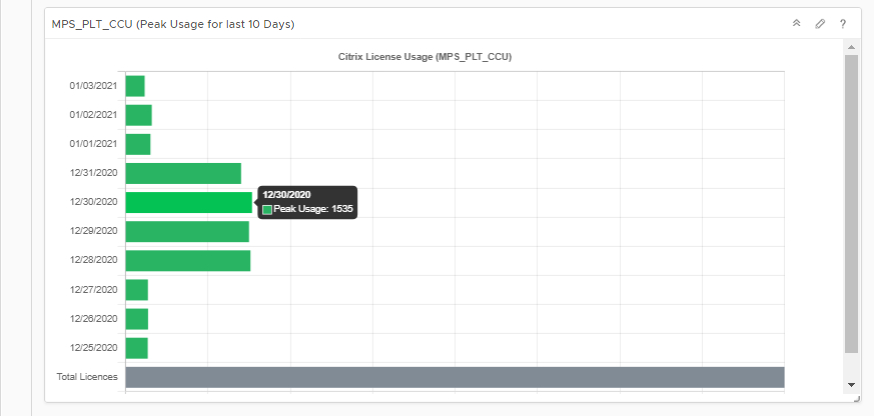
I wanted to create a half donut chart to show the highest license usage in the last 30 days, a horizontal bar chart to show the last 10 days and a table to show the last 24 hours. I reviewed to see what “Open Source” Javascript options were available and I found ChartJS. After reviewing how to program the files to create charts with ChartJS I liked the solution.
ChartJS Displayed in vRealize Operations using the “Text Display Widget”
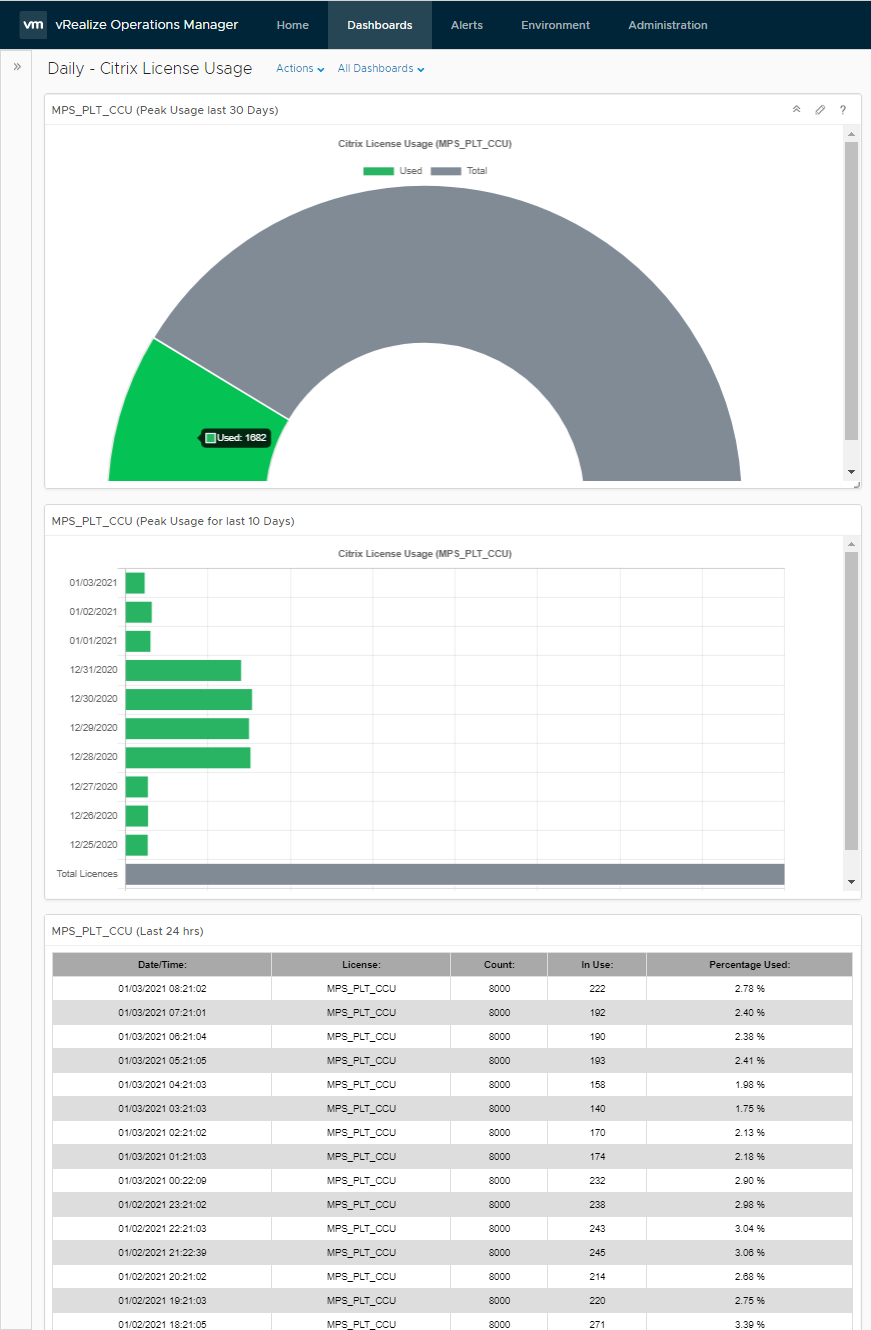
ChartJS Half Donut.
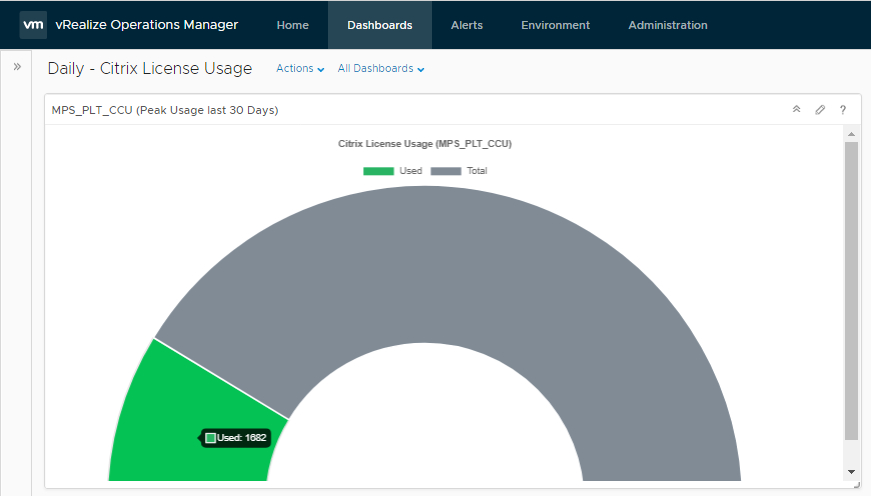
When you hold the mouse over the chart you will see the values.
ChartJS Half Donut code:
|
|
ChartJS Horizintal Bar Chart.
ChartJS Horizintal Bar Chart code:
|
|
- Read all the documentation on how to create ChartJS files. Very important steps need to be followed.
- All the Web pages to show Citrix Licence counts are updated very hour.
- The process to update the Web Pages is scheduled with vRealize Automation Orchestrator.
- The code to get the license information and create the web pages is all done with PowerShell.
- The License values collected every hour are saved in a Microsoft SQL Database.
The process to save the data and create the web pages can be done many different ways. I outlined how I do it in my environment. What I feel was important to show was the finished HTML code to create the ChartJS Web Pages that I display in vRealize Operations. The data could be from any source that makes sense in your environment. This makes a great way to graphically show data within vROPS from data that is saved outside of vROPS.
Link to my blog post that shows how to use the “Test Display Widget
- If you found this Blog article useful and it helped you, Buy me a coffee to start my day.