Text Display Widget - More Powerful than just displaying text on a Dashboard...

vRealize Operations - Dashboards:
I was recently reviewing some sample custom vRealize Operations Dashboards and I seen where some of the Dashboards had custom text and images. I reviewed how they included the text and images and in some of the sample Dashboards they used the “Text Display” Widget and used a url for the content. They would display images saved on a web server. I thought this was interesting and started reviewing what else could be displayed by using a url with the “Text Display” Widget.
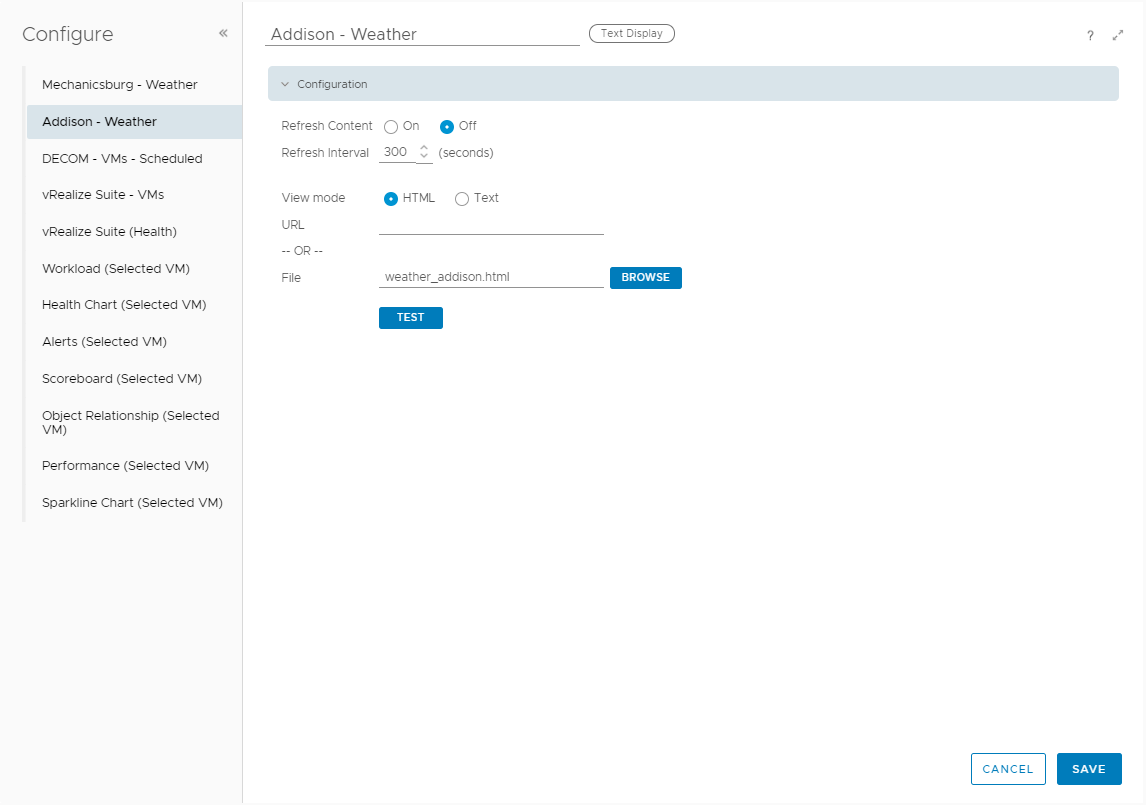
The first thought I had was to display the weather for both the data center locations where I work. This could be used with a NOC type Dashboard. I looked online for a weather widget site and got the code to display the weather for the specific locations. If you go to Administration/Configuration/Metric Configurations/TxtWidgetContent you can create html files to save the widget code. See examples in images below. You can display any Widget data from any web site that provides widgets using the “Text Display” Widget.
After I successfully added weather widgets I wanted to get more serious and show data from a SQL Database. I use a SQL database to store data from some vRealize Automation Day 2 BluePrints that I created. Some example BluePrints where I store data in a SQL DB are Server Builds and Server Decomissions. I created a web page that displayed the SQL Data and added another “Text Display” widget to the Dashboard. I used the url of the web page and assigned it to the widget and now I am also able to show SQL Data on a Dashboard.
The reason I wanted to show Weather and SQL data is to use vRealize Operations Dashboards as the “Single Pane of Glass” for all monitoring. I have never seen a demo from VMware to use the “Text Display” Widget this way but I think this is awesome. This could completely change the way I use vRealize Operations Dashboards. There are not always vRealize Operations Management Packs available and this provides a cool way to show any data on a Dashboard. The data will be for reference only but it does allow the “Single Pane of Glass”.
vRealize Operations Dashboard:
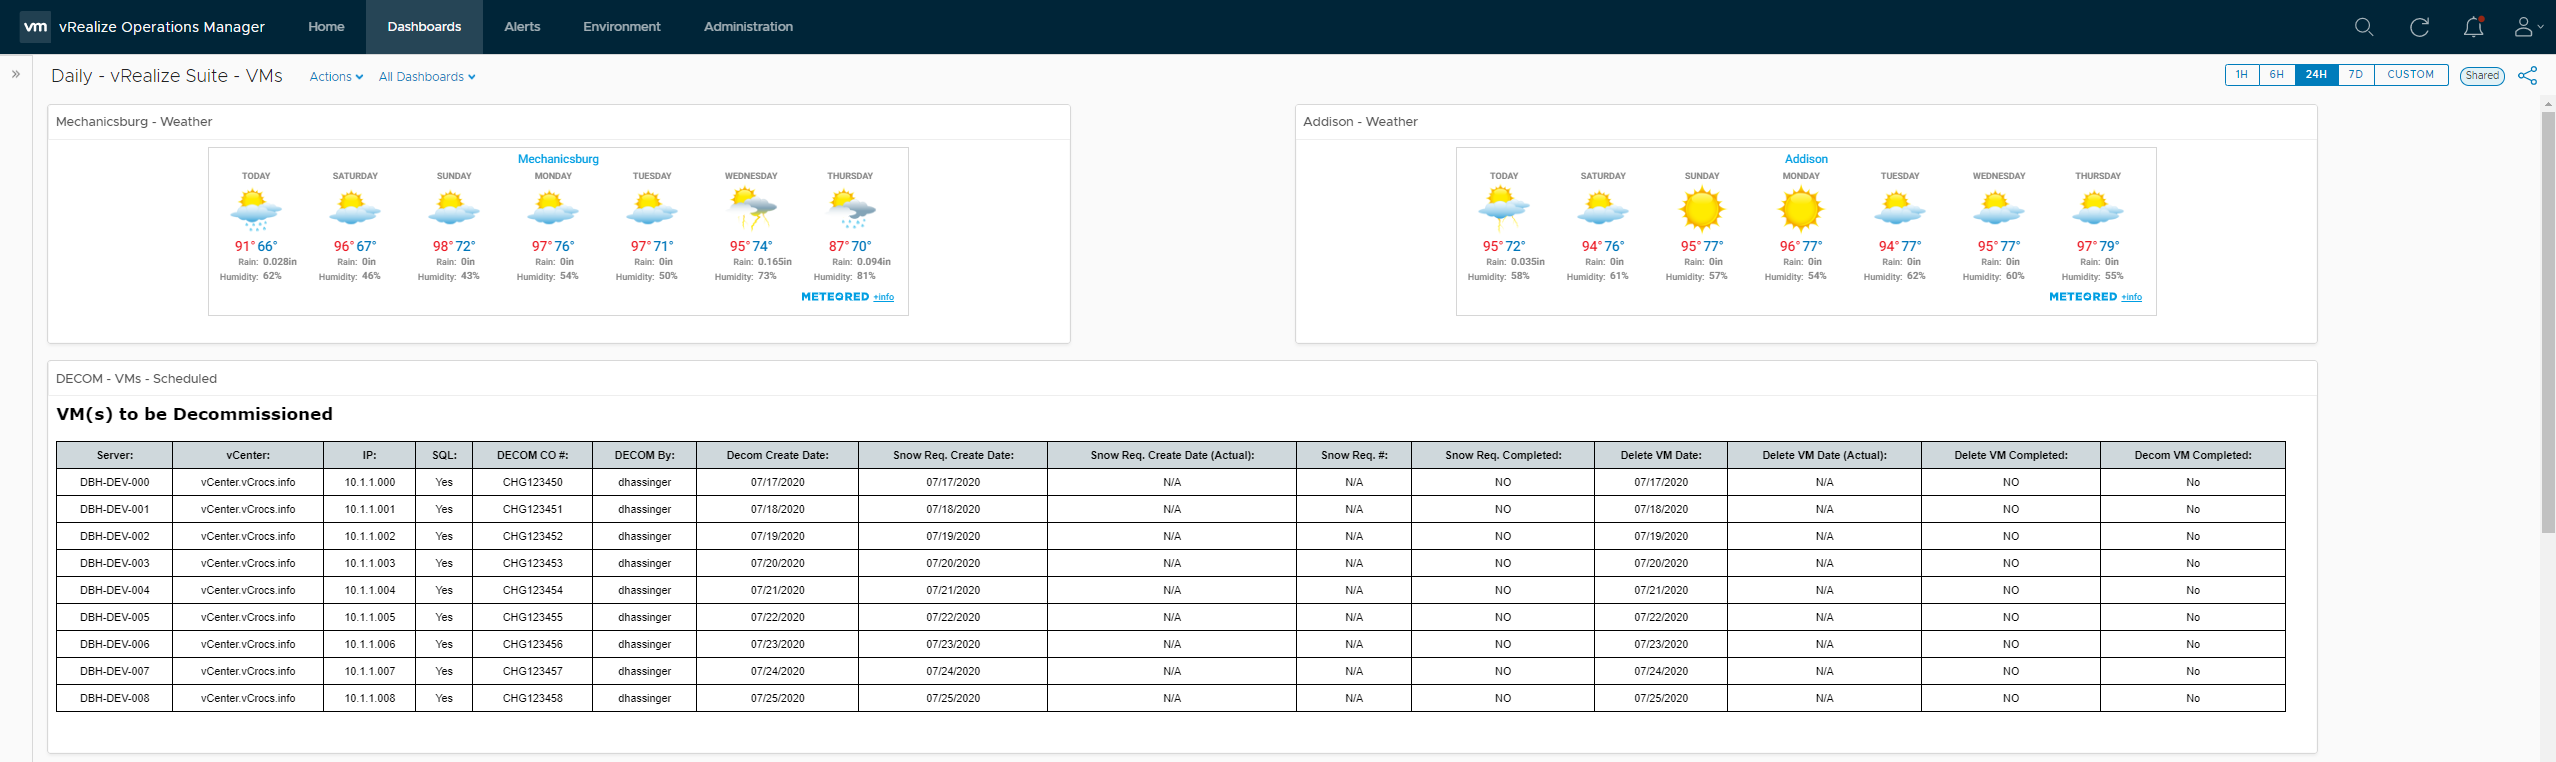
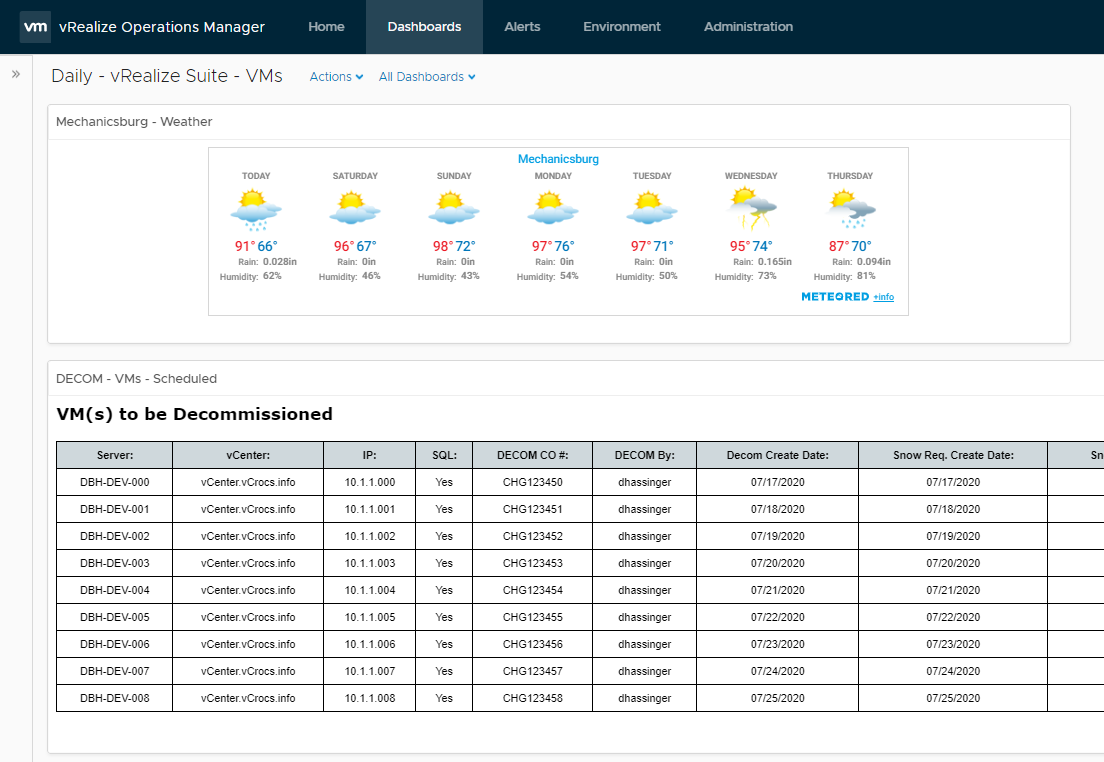
Here is a closeup of the Dashboard so you can see the details.
Widget Code:
Administration/Configuration/Metric Configurations/TxtWidgetContent
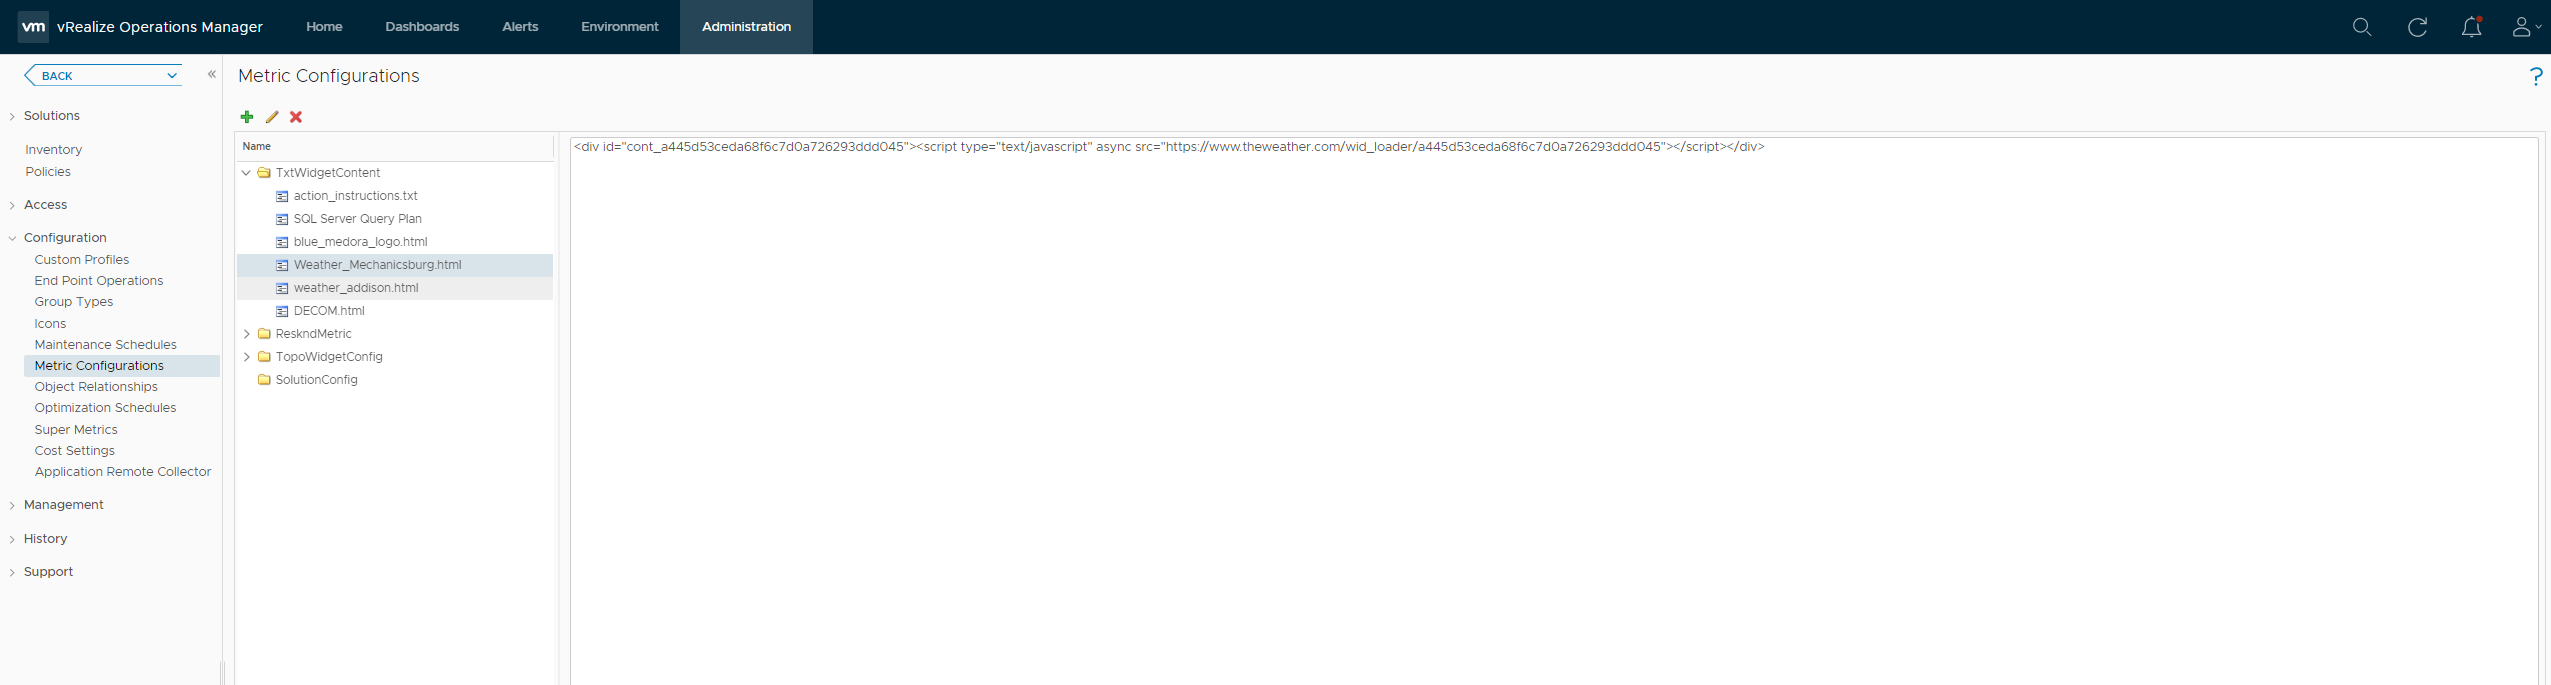
Here is a closeup. Create a html file and paste the Widget Code.
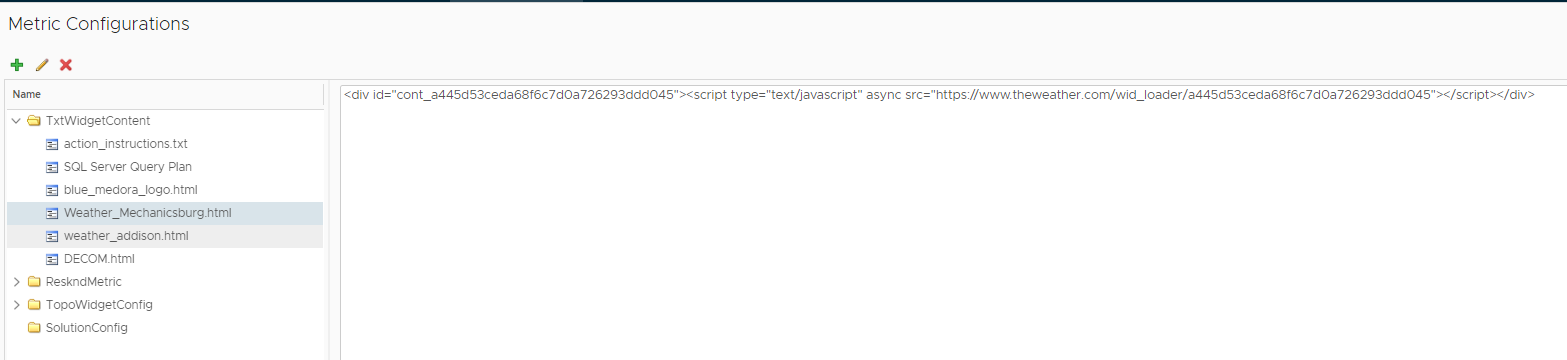
Select the html file created to show the widget data
url Page:
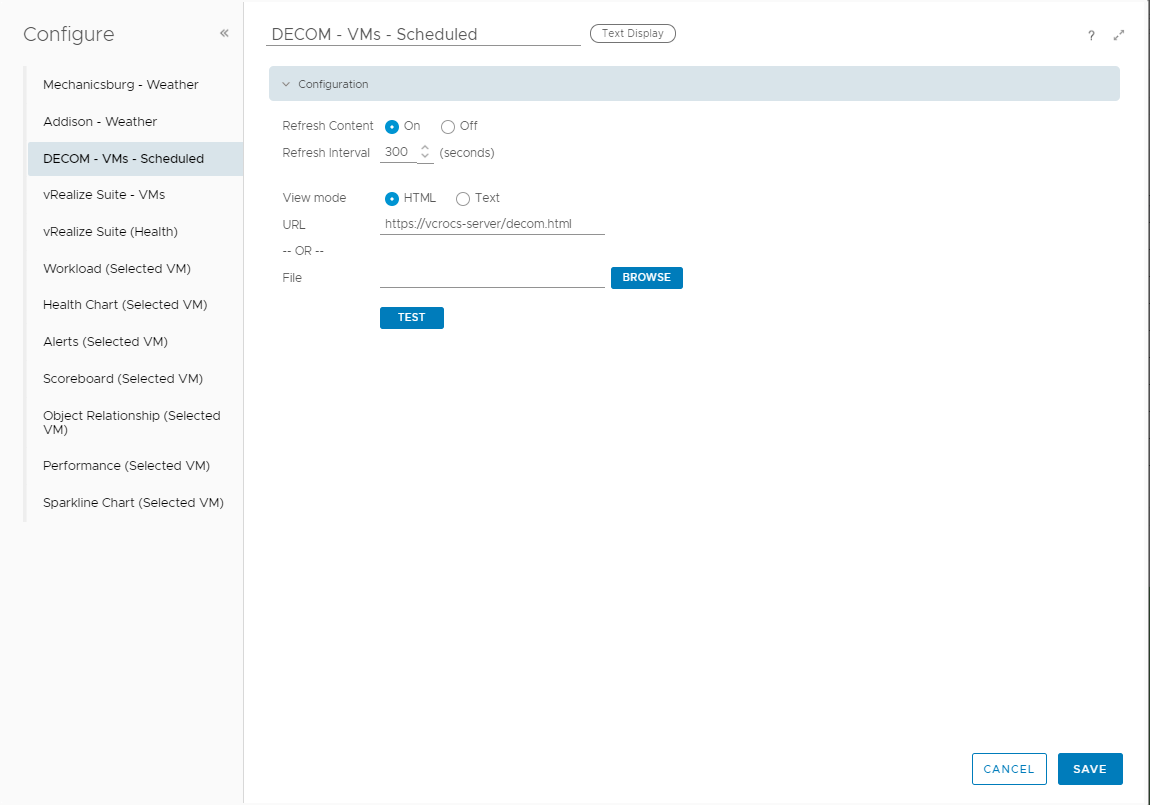
The url web page could be a static or dynamic page. Use whatever works best for you. I think this opens up so many possibilities of what you can display on a Custom Dashboard. If you want to take it a step further you could publish the Custom vRealize Operations Dashboard with Workspace One and provide the data to anyone in your organization even if they are not a vRealize Operations user. Cool Shit!
The “Text Display” Widget should be renamed to the “Cool Shit” Widget!
- If you like wearing Crocs and want to get a pair like I wear, follow this link to Amazon: My Favorite Crocs
- If you found this Blog article useful and it helped you, Buy me a coffee to start my day.