vRealize Operations 8.x - New Features

Contents
The New Features I use the most.
- Donut Charts.
- This is one of my favorite new features.
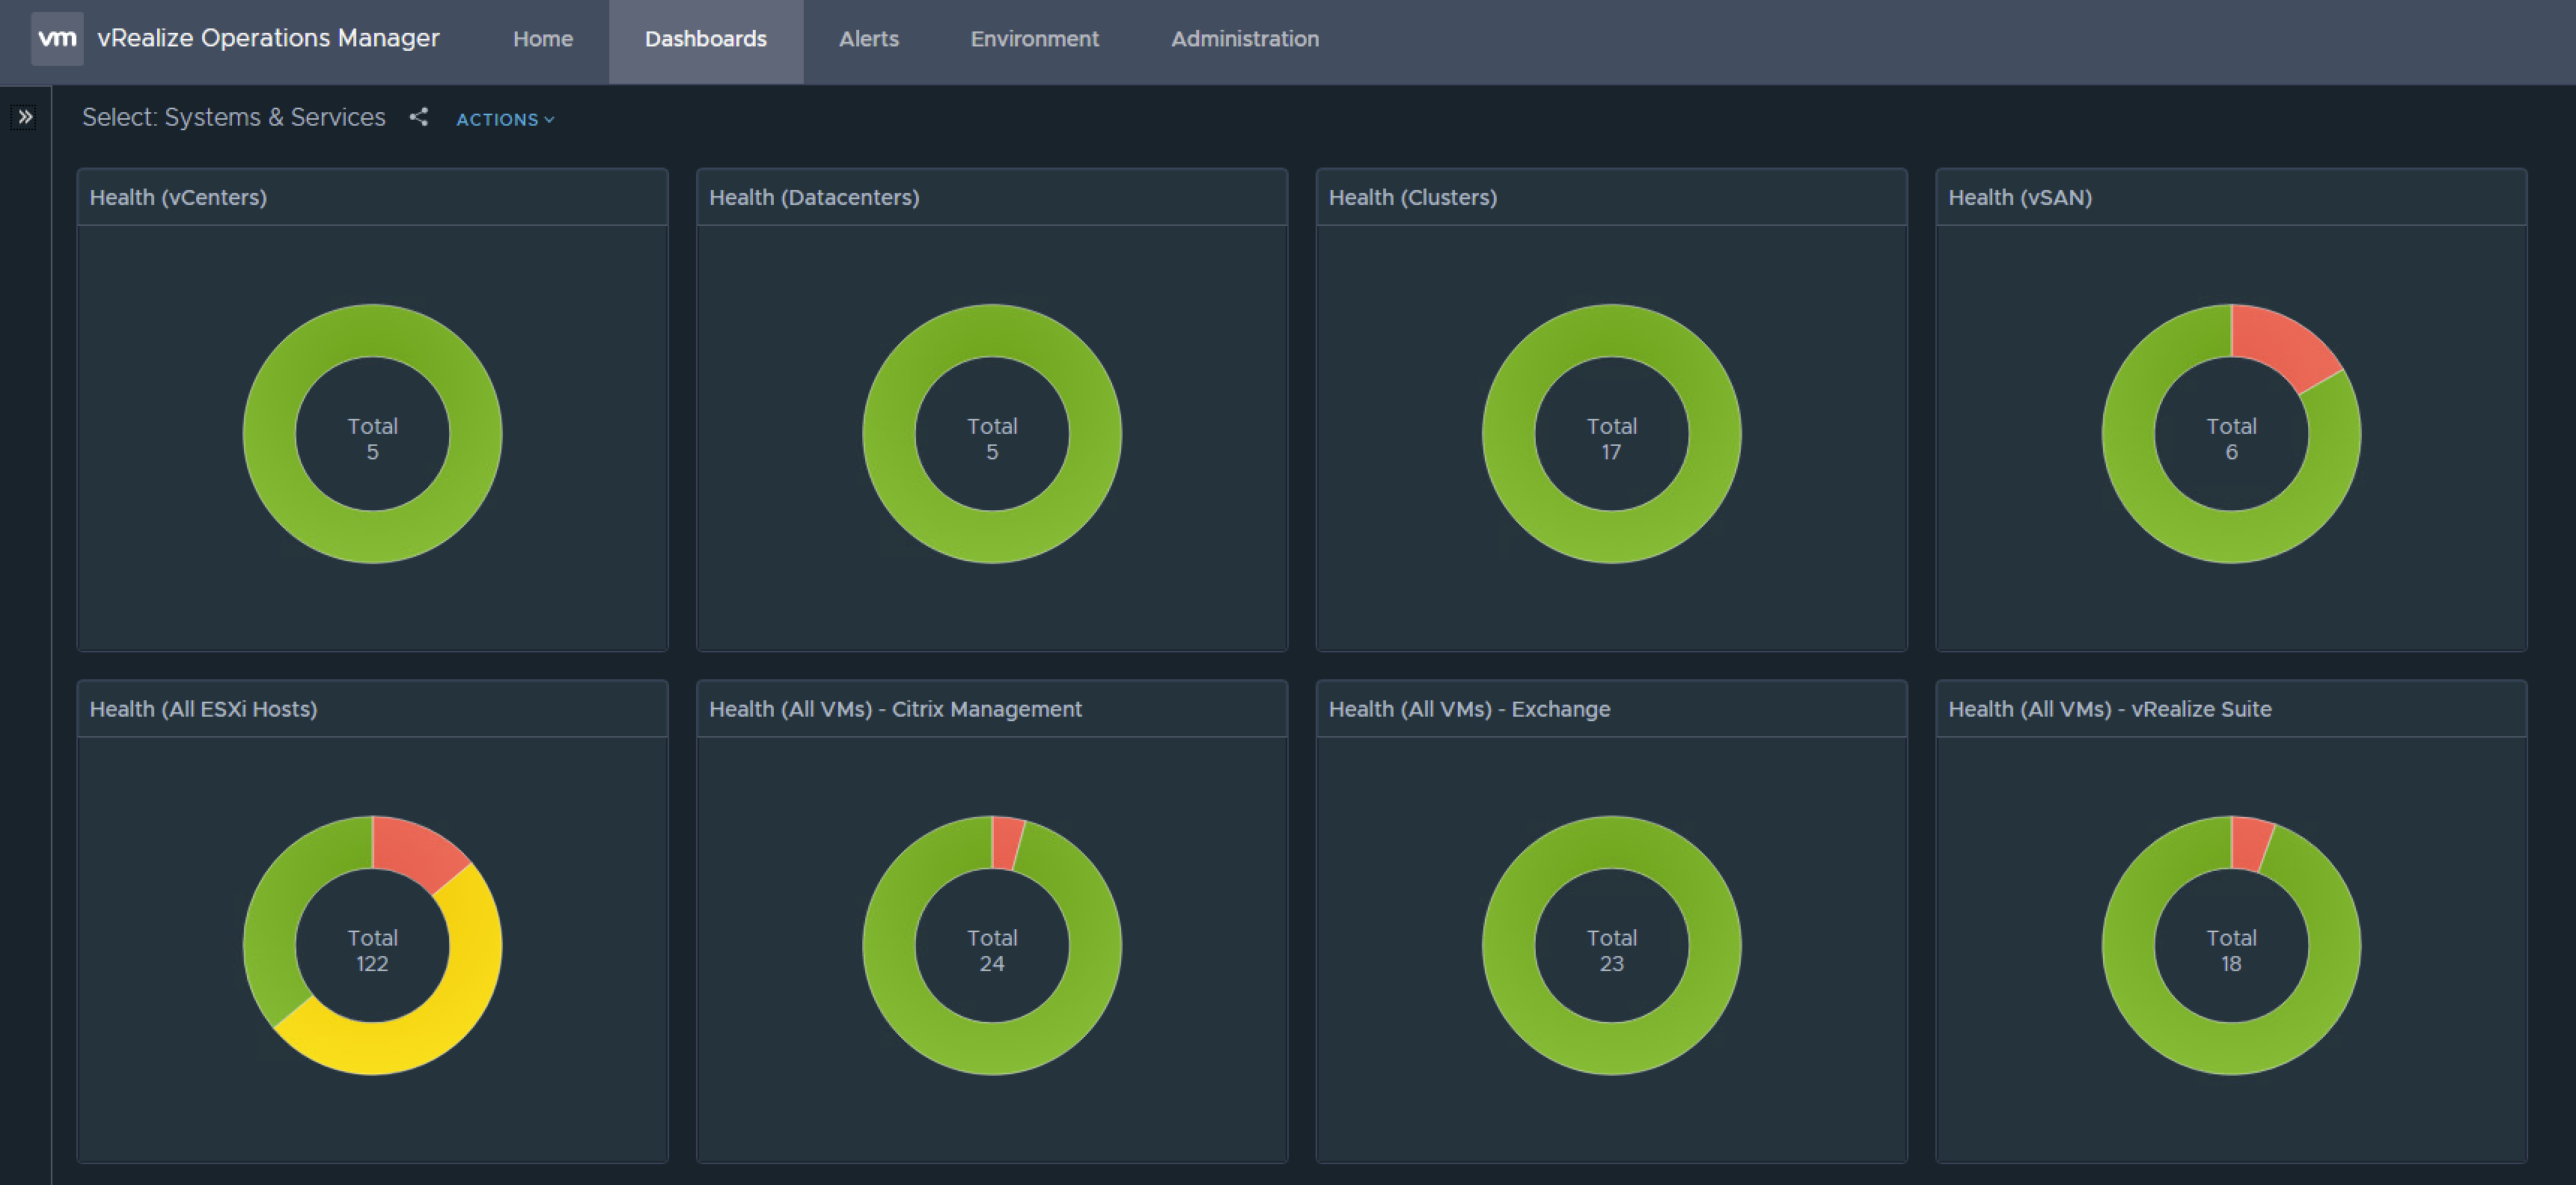
- The donut chart allows you to show a lot of information in a smaller space and makes the Dashboards look more modern and clean looking.
- I have been replacing the Heat Map Widgets on some of my custom Dashboards with Donut Charts.
- If you click on the colors of the Donut charts you will then get a list of the data that makes up that color.
- Top-N Chart and Color Method.
- Adding color to the Top-N makes it so much more usable. With the previous version where is was just blue it didn’t grab your eye like adding the color.
- Using the Top-N chart and the Donut chart together makes a GREAT looking Dashboard. See my example below.
- Ping Monitoring.
- This feature always us to monitor non VMware devices. In a short period of time I learned a lot about latency and packet drops in our environment.
- Troubleshooting Workbench.
- In previous versions of vROPS I would create Dashboards to help with trouble shooting.
- With Trouble Shooting work bench I don’t need to create those custom Dashboards anymore.
- The included Trouble Shooting workbench is like what I did on steroids.
Donut Chart and Top-N Example:
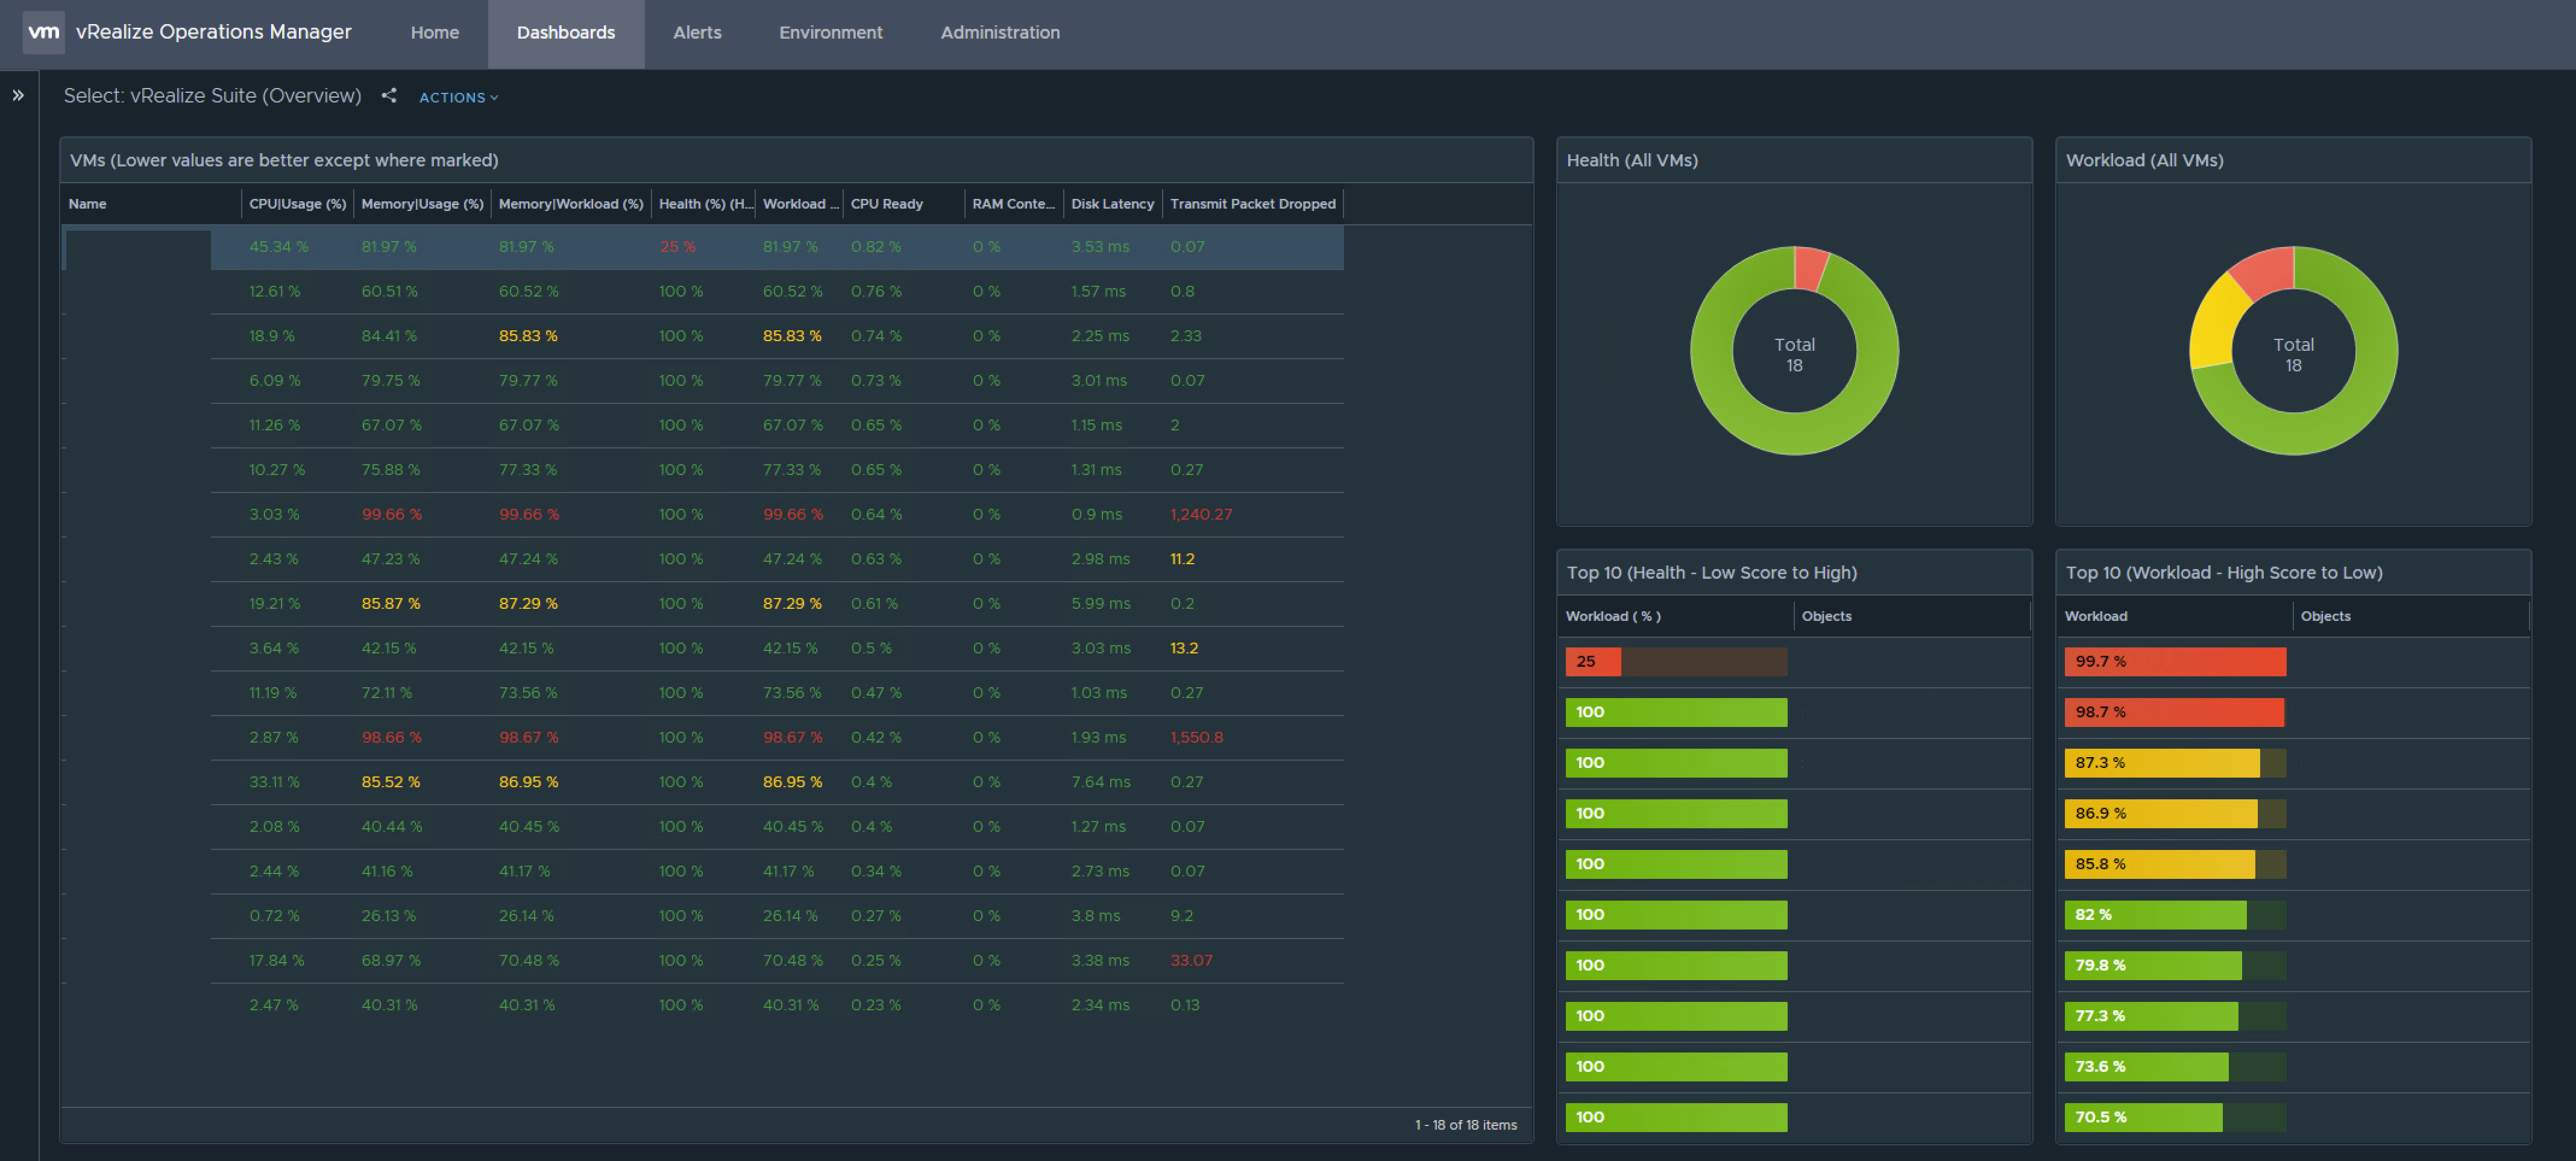
This single Dashboard has a lot of info that would has taken several Dashboards to show same amount of data using Heat Maps. This would be a good example of a Dashboard that managers may want to see.
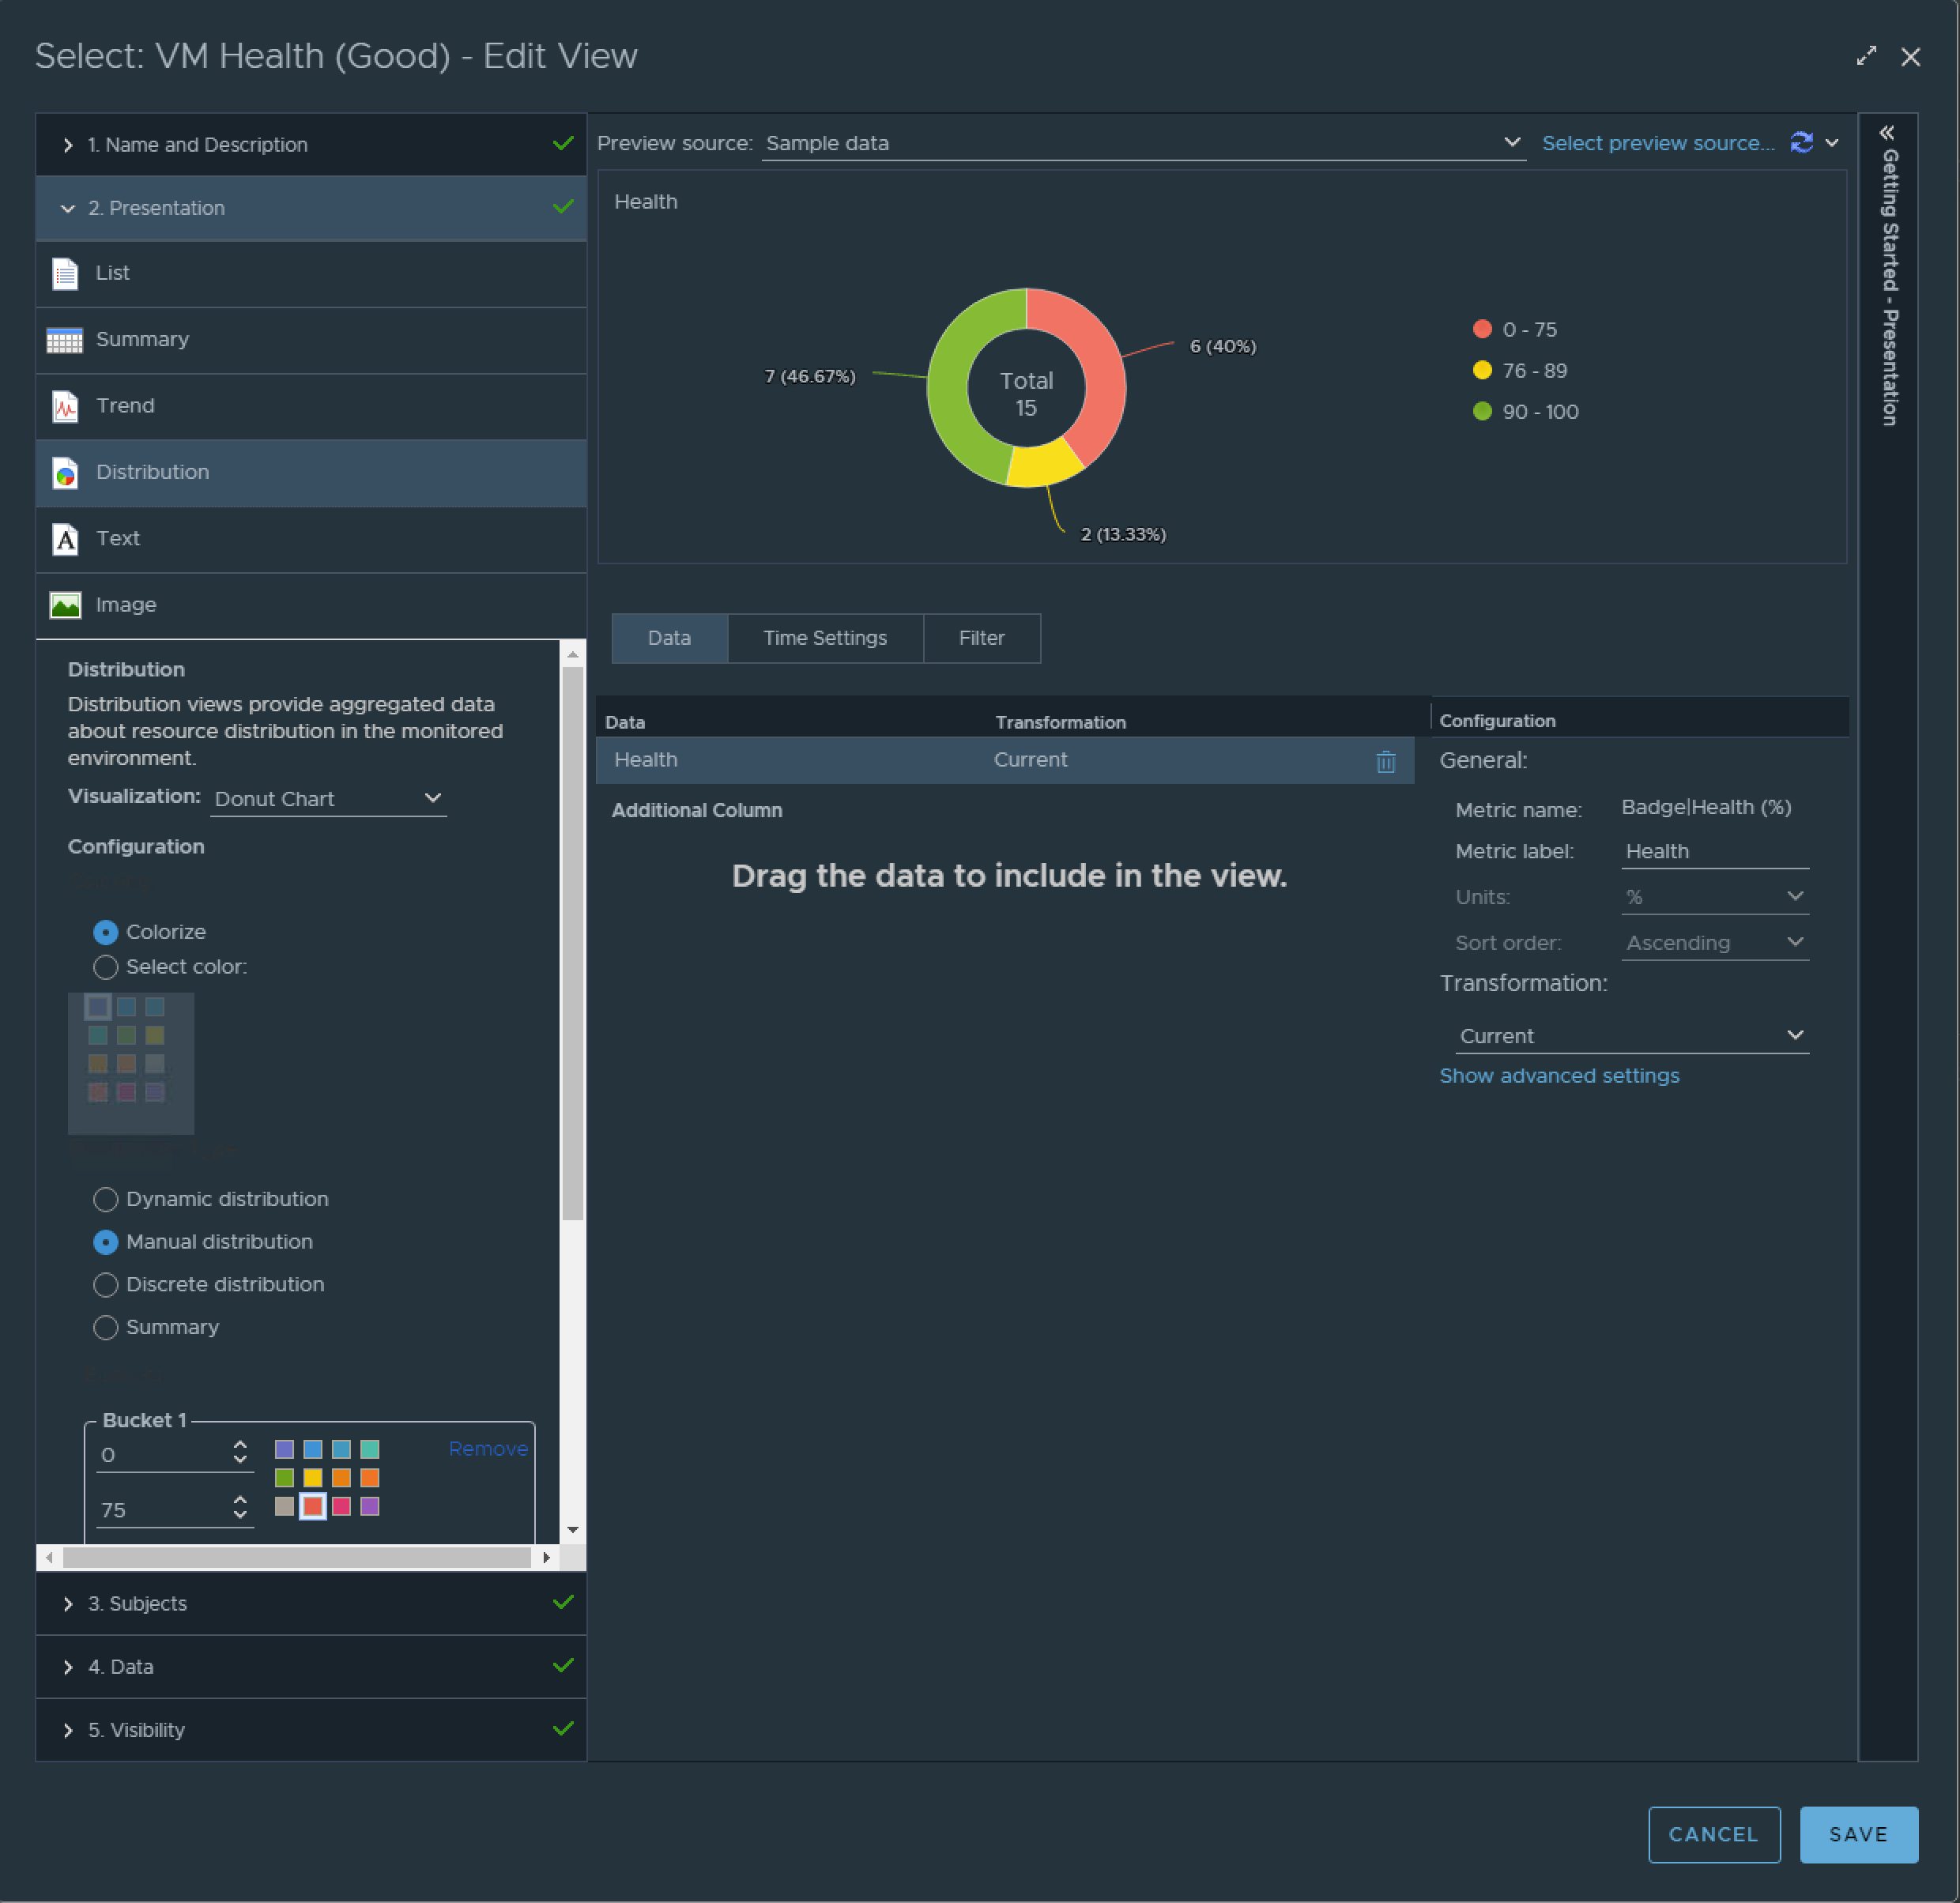
Donut Chart Config:
- Create a Distribution View.
- Make the visualization a Donut Chart.
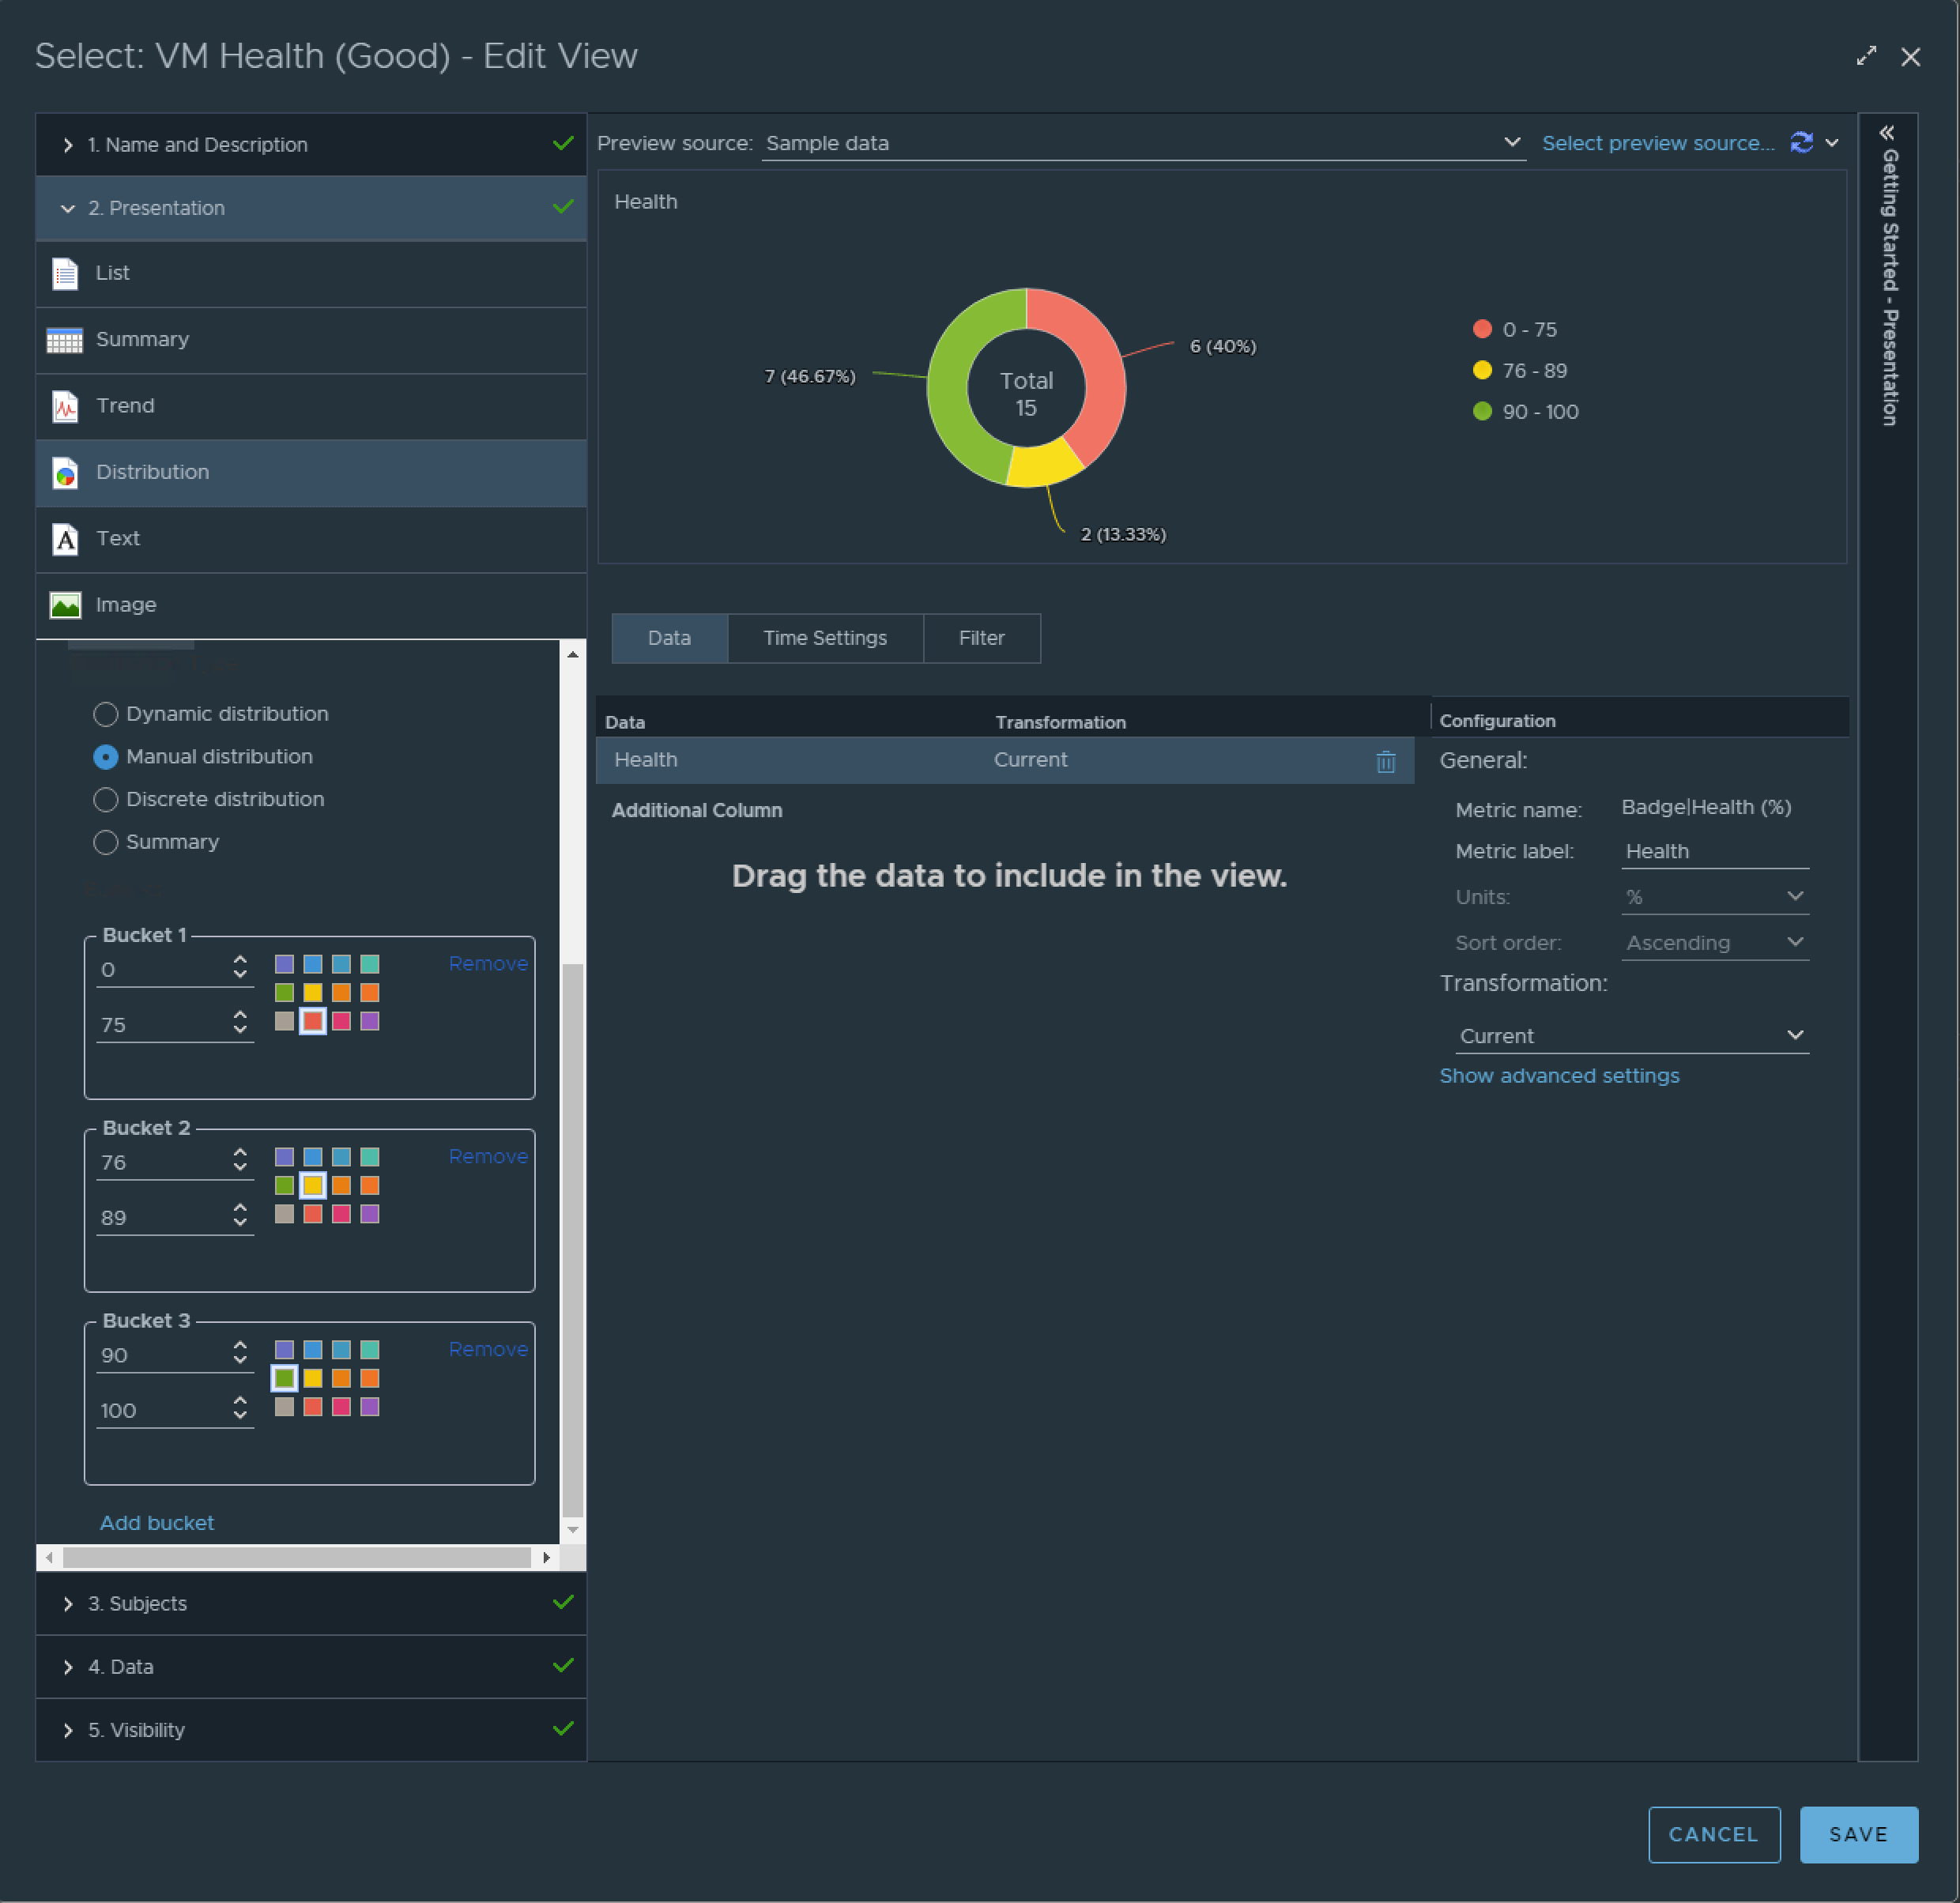
- Use Manual distribution.
- Create Buckets and set the values/colors for the Buckets.
- Add the View to a Dashboard.
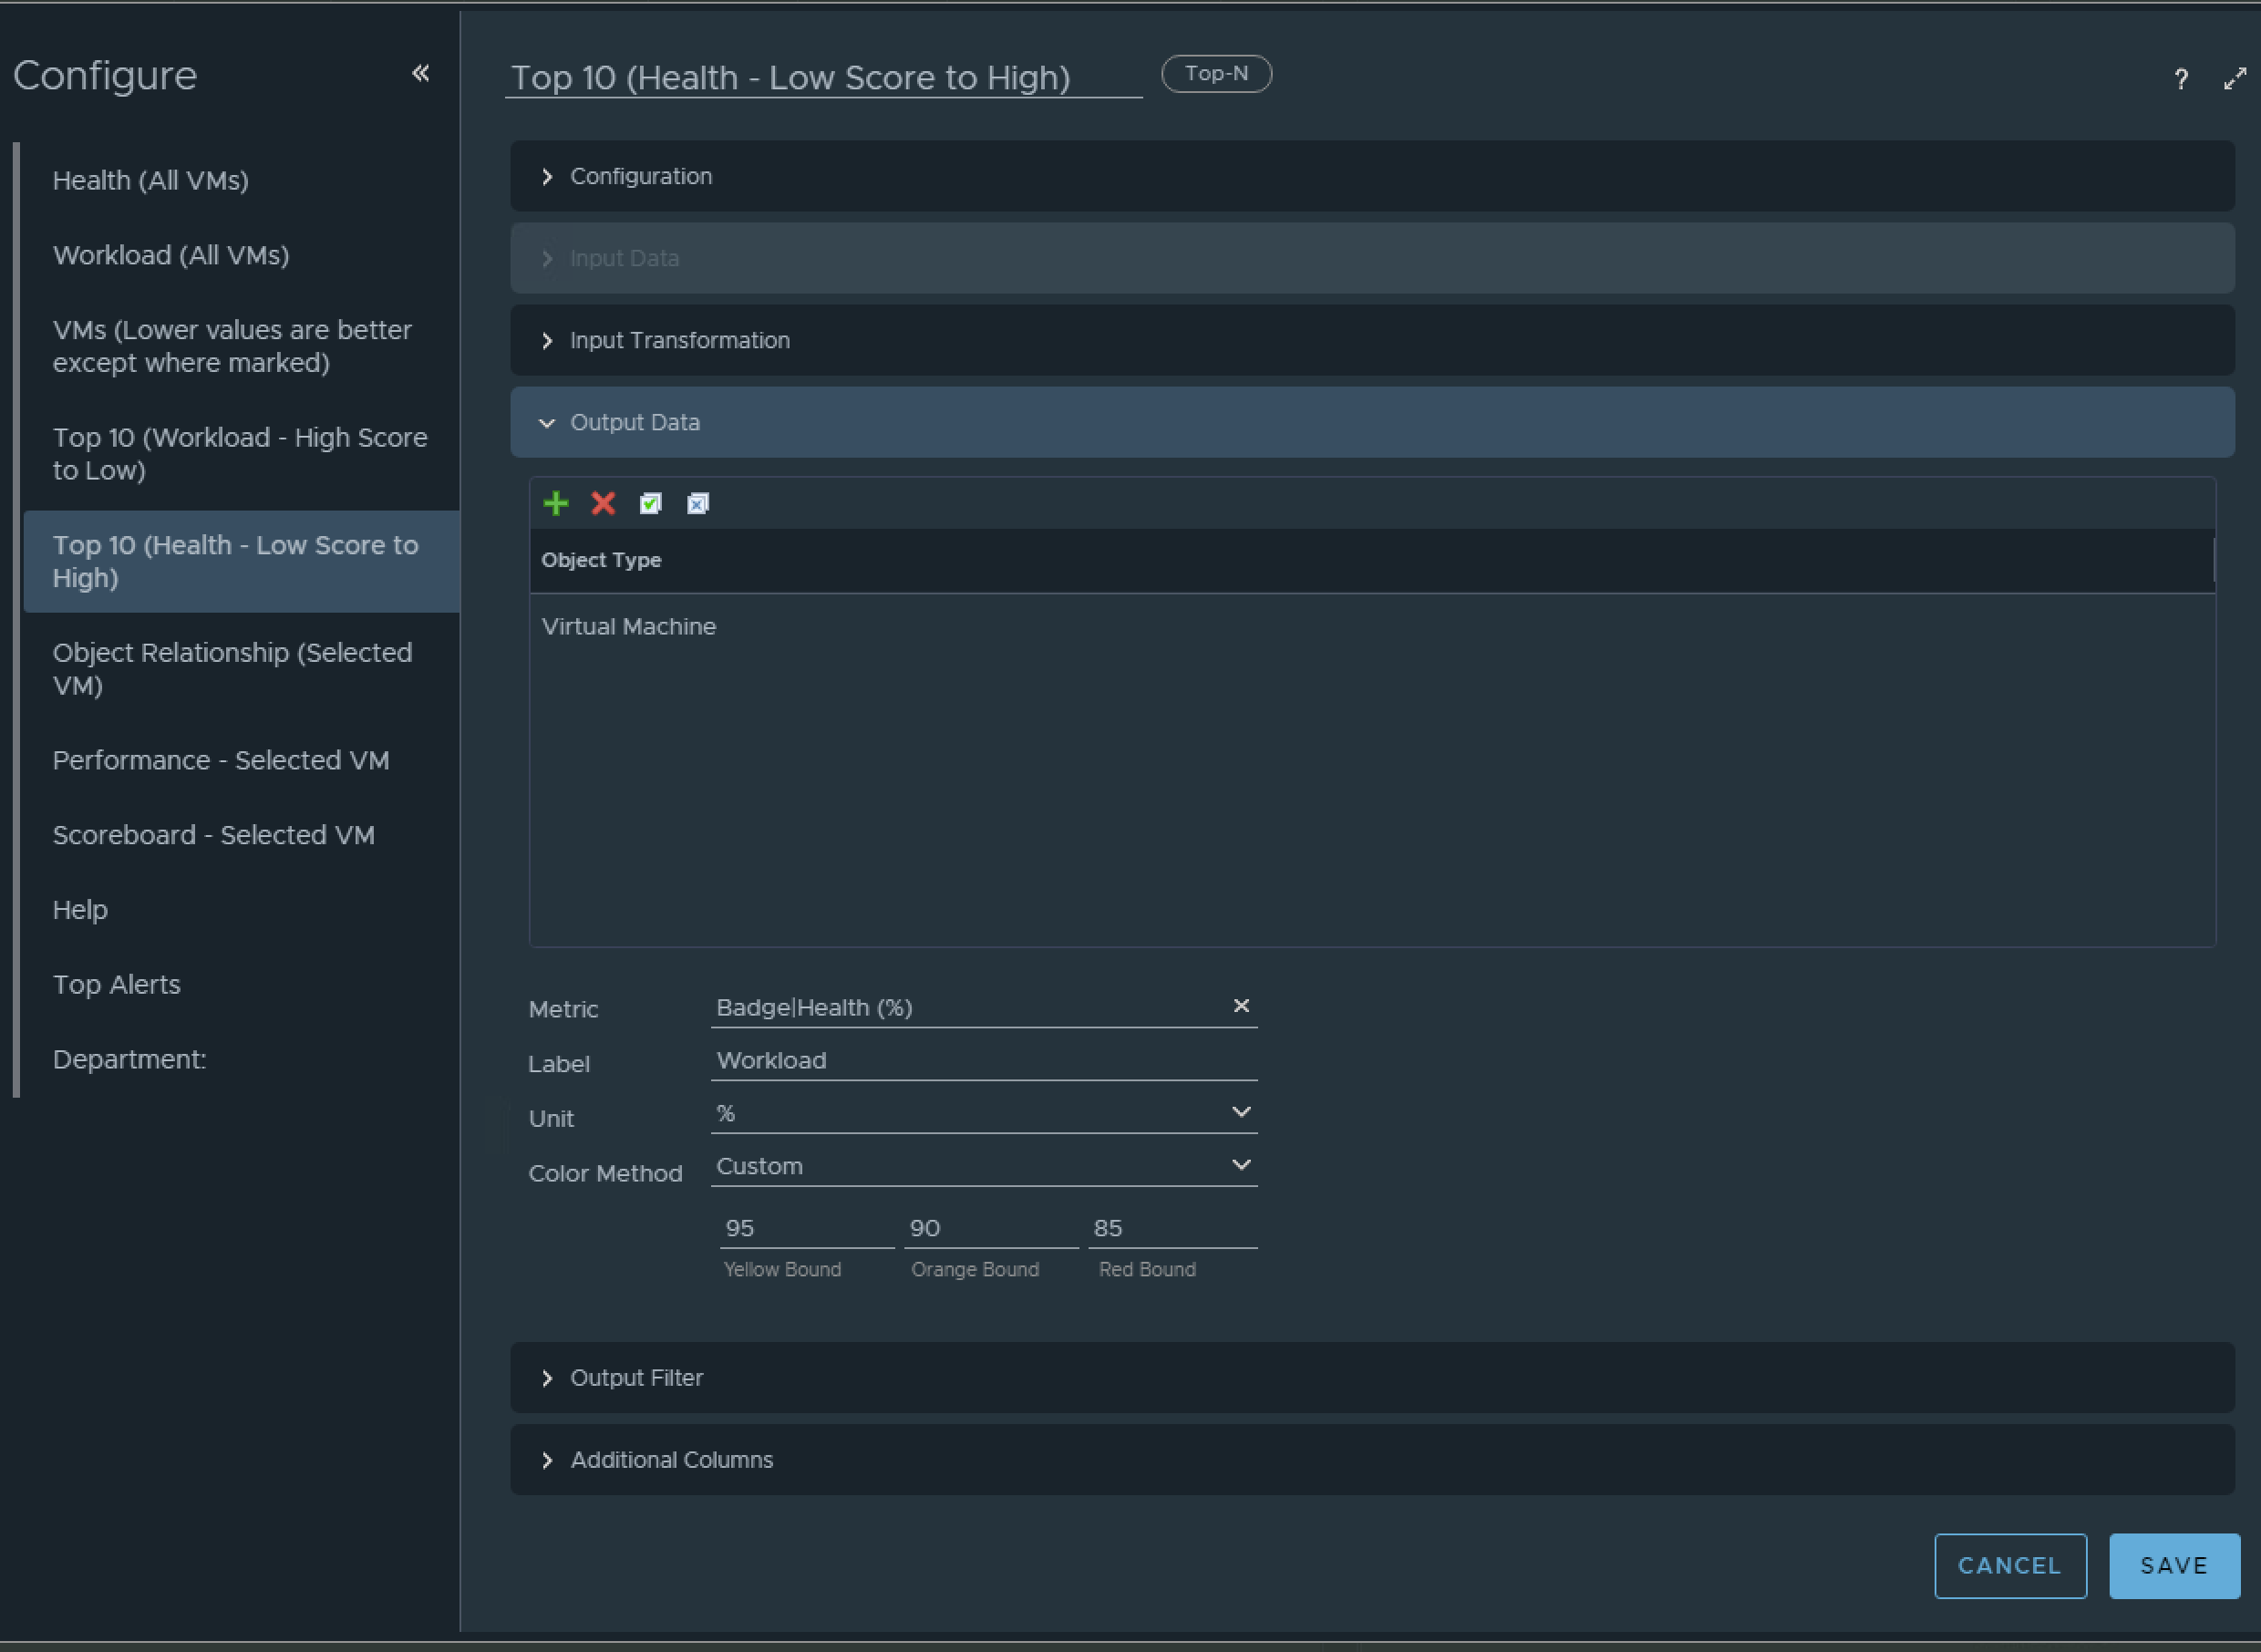
Top-N Chart Config:
- Add Top-N Widget to Dashboard
- Define configuration and Input Transformation.
- Output Data:Color Method:Custom is where you define the color values.
- If you found this Blog article useful and it helped you, Buy me a coffee to start my day.
Comments: