
vCommunity Observability | My Home Lab on the Apple HomeView

vCommunity Observability: My Home Lab on the Apple HomeView 🏠
I'm an Apple fan boy. The first thing I wanted to use my Apple HomeView for was to monitor my home lab. Not a weather widget. My vCenter, my hosts, my datastores.
My vCommunity Observability project already collects that data for its dashboards. So I added a new module that puts it on the HomeView screen: a full-screen display that cycles through the lab on its own. I wanted to share how it works with the vCommunity. I ❤️ the design so far.
What is the Apple HomeView Module? 💡
It is a module in vCommunity Observability called apple-homeview. It is one web page, /homeview, built for a 1088 × 1088 square touch screen. It shows eight pages:
| Page | What it shows | Data from |
|---|---|---|
| Home | Clock, greeting, vCenter, hosts connected, VMs running, Needs your attention, host CPU and memory | DBH Insights |
| Lab | Hosts, running VMs, datastores, health findings, compute, a storage ring, clusters with HA / DRS | DBH Insights |
| Hosts | CPU and memory meters, VMs, version, state for every host | DBH Insights |
| VMs | Running, powered off, templates, snapshots, Tools to upgrade, and the busiest VMs | DBH Insights |
| Storage | Total, free, lowest free %, every datastore with used %, free and runway | Datastore Capacity |
| Clusters | Hosts available, VMs on, vCPU : core, vRAM % of DRAM, N+1, datastore free % | DBH Insights |
| Health | Findings by type and every finding | DBH Insights |
| GitHub | GitHub status, components and incidents | GitHub Status |
The GitHub page is there on purpose. It shows that a page can come from any module, not only the lab. Monitor data that is important to me.
The module has no collector of its own. It reads what the other modules already collected, so it adds no load on vCenter. The page reloads its data every minute.
The Pages 📊
Every screenshot below is the full 1088 × 1088 canvas.
Home (Screen Shot):

Lab (Screen Shot):

Hosts (Screen Shot):

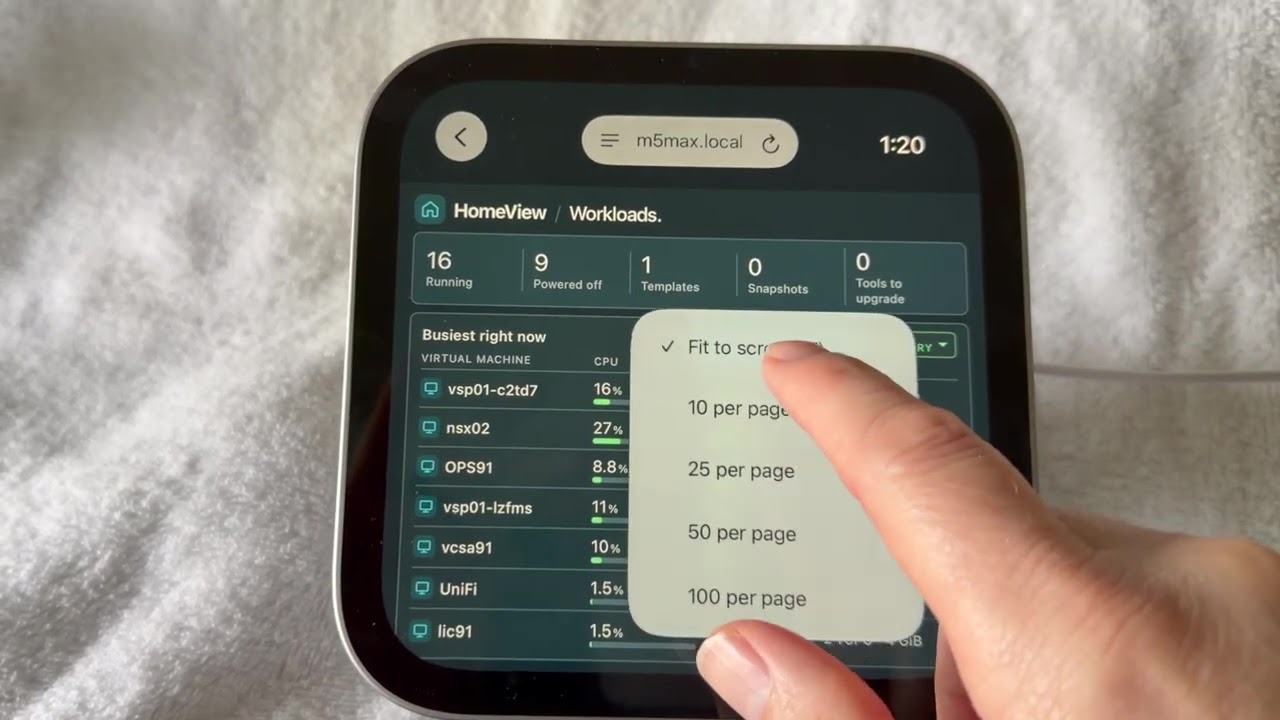
VMs (Screen Shot):

Storage (Screen Shot):

Clusters (Screen Shot):
Health (Screen Shot):

GitHub (Screen Shot):

No Scrolling. Ever. (Unless You Ask) 📐
- An Apple HomeView Dashboard you have to scroll is not a good design. This was the rule for every page, and it took the most work.
- The square canvas scales. Every page is drawn on a fixed 1088 × 1088 canvas.
- Short, wide screens get a compact layout. On the HomeView, Safari's controls take part of the screen, so the page often gets a short, wide space (about 1000 × 450). Scaling the square down to 450 px would make the text too small to read. A CSS media query catches that shape. The canvas stops scaling, the text drops to 8–13 px, secondary lines hide, and the rows share the height that is left.
- Long lists become more pages. A page shows only the rows that fit. With 17 hosts, the Hosts page becomes Hosts 1, Hosts 2 and so on. Auto-cycle shows every one of those pages in turn.
- Every pixel goes to the data. Early versions had a tab bar at the bottom and a big title on each page. Both are gone. The page title now sits in the top row next to HomeView, and the home icon opens the page menu. That freed space for more rows on every page.
Your Choice: Show More, Sort Differently 🔧
No scrolling is the default. Sometimes I want to see all 40 VMs at once anyway. So each long list has two menus in its header:
- Show: Fit to screen (the default) or 10, 25, 50 or 100 per page. A number scrolls inside the list, and the column headings stay in view.
- Sort (the green tag):
- VMs: BY CPU or BY MEMORY
- Hosts: BY NAME, BY CPU or BY MEMORY
- Storage: BY USED, BY RUNWAY, BY SIZE or BY NAME
The HomeView remembers each choice for each page.

Dashboards Menu (Screen Shot):

Settings ⚙️
The Apple HomeView card on the vCommunity Observability Settings page has:
- Auto-cycle seconds per page (5 to 3600, default 20)
- The page order, with ↑ / ↓ buttons
- A Show checkbox to leave a page out
The default order is Home, Lab, Hosts, VMs, Storage, Clusters, Health, GitHub. An open HomeView picks up a change within a minute. You don't need to reload it.
Settings (Screen Shot):

Watch How It Works 📺
How It Works 🔧
Apple HomeView (Safari) → vCommunity Observability /ui/homeview/data → SQLite tables from the other modules
The page asks for one JSON document a minute.
A few more details:
- Read only. The page and the JSON only read data the other modules collected. Nothing on the HomeView can change vCenter.
- Works offline. No CDN and no internet calls. It fits the dark-site rule the rest of vCommunity Observability follows.
- Modules on or off. If DBH Insights, Datastore Capacity or GitHub Status is off, its pages are simply left out.
- Colors match VCF Operations. Green, amber at 75 %, red at 90 % (datastores at 80 / 90 %).
Inside vCommunity Observability (Screen Shot):

Try It 🔗
1. Get vCommunity Observability from GitHub.
2. Turn on DBH Insights and Datastore Capacity on the Modules page, and let them collect once.
3. Open Apple HomeView in the sidebar, then Open full screen.
4. On the HomeView, goto http://your-server:8080/homeview.
5. Open the vCommunity Observability HomeView web Page on your iPhone and hold it near the HomeView screen. Boom! You’re now monitoring your home lab.
For the Techies 🤓
- The page is plain HTML, CSS and JavaScript. No framework.
- The canvas and colors come from my own HomeView design. The live pages are layered on top without changing its stylesheet.
- The module's
web.pyadds three routes:/homeview, its static files and/ui/homeview/data. - Each list sends up to 100 rows, and the browser splits them into pages.
- Built with Claude Code, one screenshot and one "make this smaller" at a time. 😎
I always appreciate feedback. Let me know what you like, and what you would add next. See you in the vCommunity!