VCF Operations | CPU|Overcommit Details

See your CPU|Overcommit at the Datacenter, Cluster and Host level.
My CPU usage is like my Energy Drink intake — dangerously high and probably not sustainable.
CPU|Overcommit:
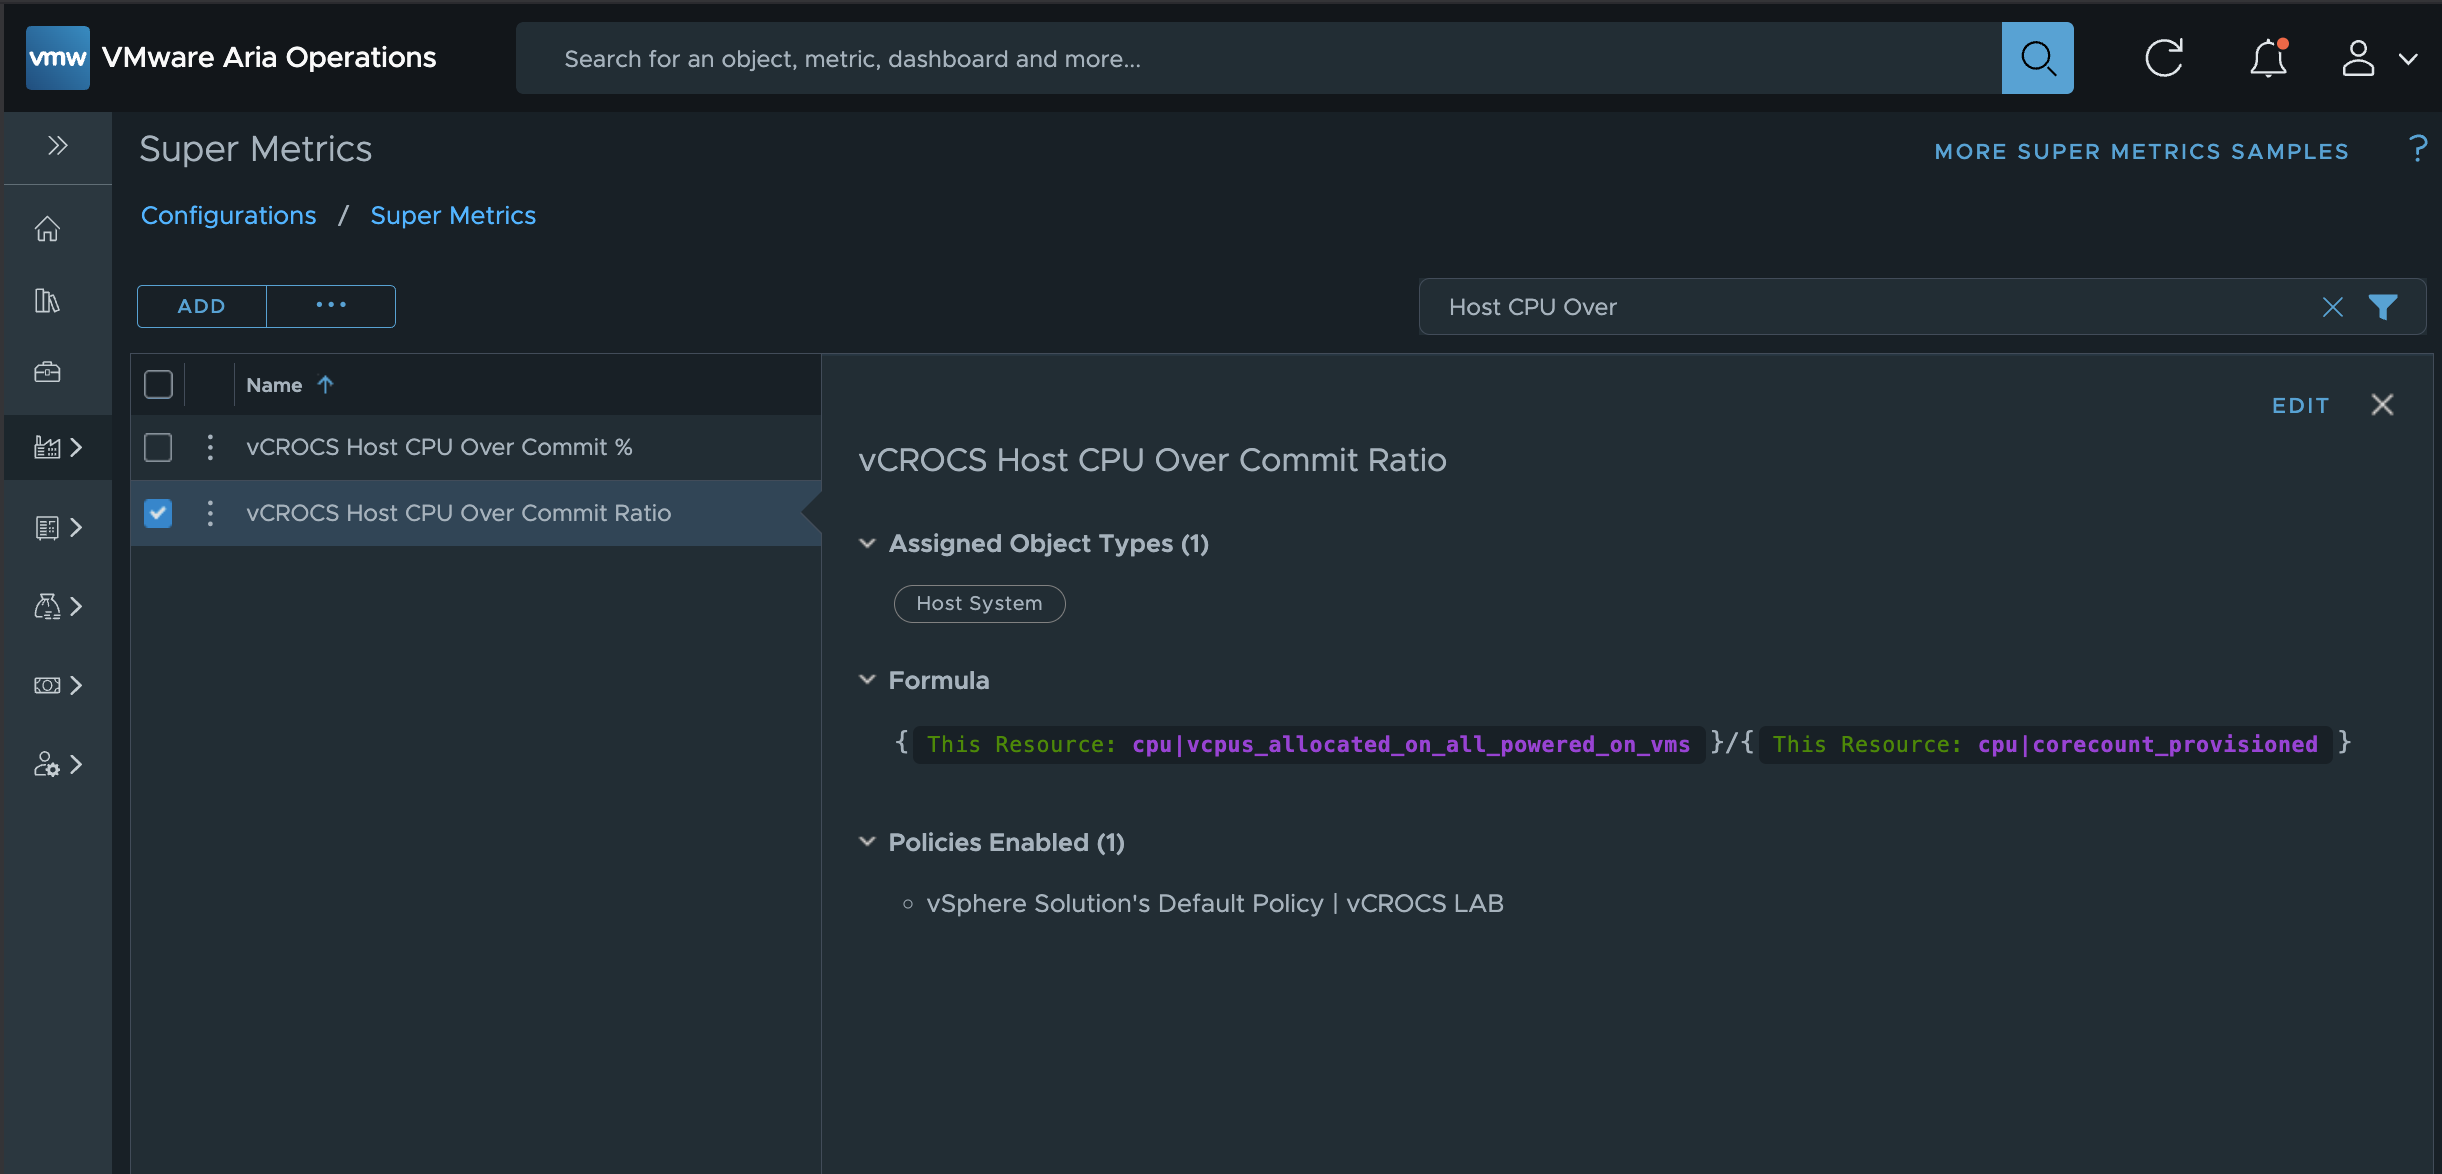
Many of my blog posts stem from real-world questions I encounter. Recently, someone asked about the CPU|Overcommit ratio for a specific ESXi host. When I checked VCF Operations, I noticed that CPU|Overcommit metrics were available at the Datacenter and Cluster levels—but not at the Host level.
To address this gap, I built a Super Metric to calculate the CPU|Overcommit ratio at the host level. You can find the Super Metric formula below.
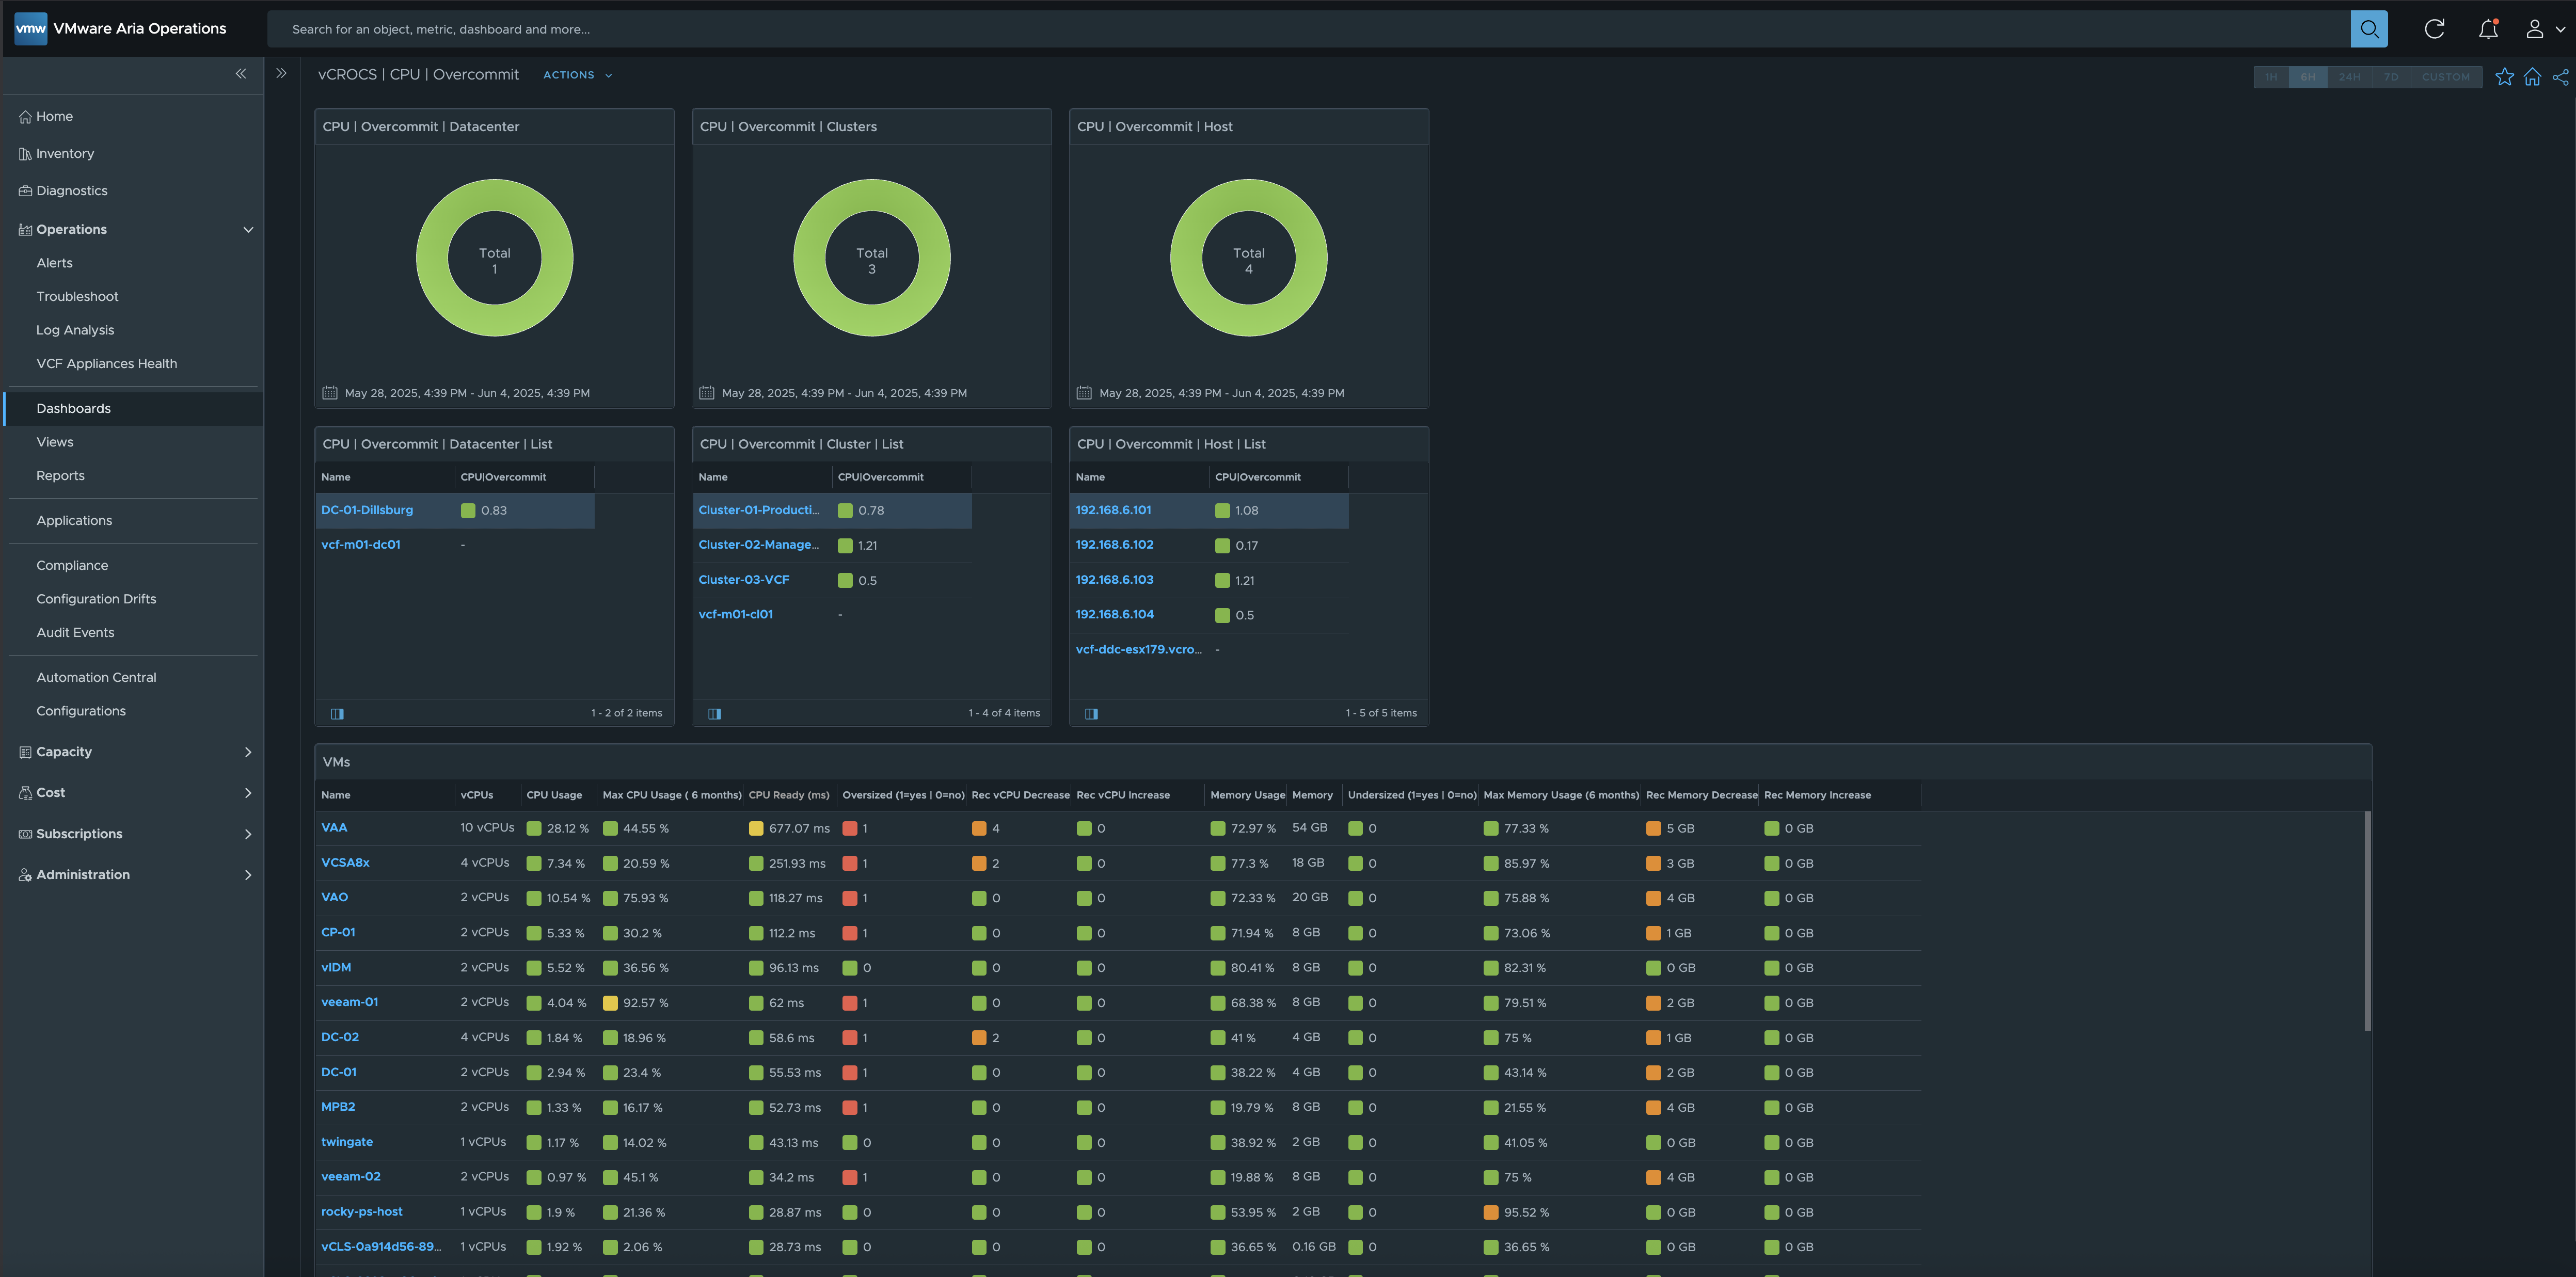
To make it easier to visualize CPU|Overcommit ratios across all levels—Datacenter, Cluster, and Host—I also created a custom dashboard. An example of this dashboard is shown below.
CPU|Overcommit isn’t inherently a bad thing—in fact, it’s one of the main reasons we virtualize: to efficiently share physical resources across VMs. The key is finding a CPU|Overcommit ratio that works for your specific environment and workloads.
That’s why I included the VM Details widget in the dashboard—to help you monitor important metrics like CPU|Ready (ms). Different workloads and use cases will tolerate different levels of overcommit, so keep an eye on performance indicators and adjust accordingly.
By default, the CPU|Ready (ms) metric is not enabled in VMware Aria Operations. To activate it, navigate to Operations > Configuration > Policy Definition. Select your Default Policy, then click Edit Policy. Under Metrics and Properties, use the filter to search for “cpu|ready”. Select Virtual Machine, expand Metrics, then CPU. You’ll find Ready (ms) listed as Deactivated—switch it to Activated and save your changes.
Allow for a few collection cycles (typically 10–15 minutes), and the CPU Ready (ms) metric will become available for monitoring VM performance.
Dashboard Example:
Super Metric:
Click arrow to expand the yaml code:
|
|
Lessons Learned:
- Host CPU|Overcommit isn’t a metric available OOTB (Out of the Box).
- You can download all the components used to build this dashboard from my GitHub repository:
- 7 Custom Views
- 1 Super Metric
- 1 Dashboard
- Be sure to activate the CPU|Ready (ms) metric, as it’s required for displaying data in the VM Details widget.